Download

1 / 36
360 likes | 528 Views
AEIS REPORT 2009-10. SAN FELIPE DEL RIO C.I.S.D. OVERVIEW. Academic Year: 2009-10 SFDRCISD Rating: Academically Acceptable AEIS DATA SOURCES: * Assessment Program * PEIMS Purpose of AEIS Report. An Overview of the Academic Excellence Indicator System Report (AEIS).

E N D
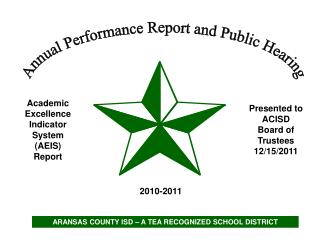
AEIS REPORT 2009-10 SAN FELIPE DEL RIO C.I.S.D.
OVERVIEW • Academic Year: 2009-10 • SFDRCISD Rating: Academically Acceptable • AEIS DATA SOURCES: * Assessment Program * PEIMS • Purpose of AEIS Report
An Overview of the Academic Excellence Indicator System Report (AEIS) The AEIS Report pulls together a wide range of information on the performance of students in each school district in Texas every year. This information is put into the annual AEIS reports which are made available to schools districts and the public during the fall. The performance indicators are: • State Administered Assessment Performance: by Special Groups, Grades, and Subjects, including Alternative Assessments • Student Success Initiative • Attendance Rates • Completion and Drop Out Rates (4 Year Longitudinal) • Percent of Graduates Completing the Recommended High School Program • Advanced Placement and International Baccalaureate (IB) Exam Results • SAT and ACT Examination Participation and Results • PEIMS Data: Budget, Financial, Staff, Demographics, Special Program Participation, Attendance, Retention, and “Leavers” (Graduates/Dropouts) • State and District Performance Reports • Campus Performance Reports
Points to Consider Do not rely on a single indicator, such as test scores, to draw absolute conclusions about student learning or school performance . • The information in AEIS provides factual foundation for dialogue about the performance of our district or campuses. Student learning and school performance should be analyzed in the context of each school's unique environment and characteristics . The opinions of parents, school staff, and students can be very helpful in understanding the strengths and weaknesses of schools . Remember to look at school performance over time. SSI-2005, 5th graders must pass the Reading and Math TAKS to be promoted. SSI-2008, 8th graders must pass the Reading and Math TAKS to be promoted. SSI-2010, 3rd graders no longer included in SSI Exemplary – For every subject, at least 90% of the tested students met standard or met standard with TPM. Recognized – For every subject, at least 80% of the tested students met standard or met floor and required improvement or met standard with TPM. Academically Acceptable – Varies by subject: Reading/ELA – At least 70% of the tested students pass the test. Writing – At least 70% of the tested students pass the test. Social Studies – At least 70% of the tested students pass the test. Mathematics – At least 60% of the tested students pass the test. Science – At least 55% of the tested students pass the test. or met Required Improvement or met standard with TPM
TAKS MET STANDARD (SUM OF ALL GRADES)(ACCOUNTABILITY INDICATOR) Yellow Highlight Indicates Increase
Analysis 3rd Grade Math in 2006 the number tested was 205 students ( % met standard =67%) In 2010 the number was reduced to 18 students (% met standard=39%)
PSAT (Pretest for the SAT)October 2008: 269October 2009: 342October 2010: 529PLAN (Pretest for ACT)October 2010: 549
College Entrance Exams SAT/ACT (updated):June 2009- May 2010: 305June 2010-December 2010: 278 December 2010-June 2011 ENROLLING
2010 Graduating class:Students attending (info is based on student admission letters and parent & student input):*4 yr university: 146*2 yr *community/technical/ vocational college: 313*Military: 49
Class of 2010Scholarship offers:Approximately 5 million dollars Applied for Financial Aid:Close to 400
National Hispanic Recognition Program Scholars:2009: 4 students Lauren Cardenas, Carlos Rubio, Carlos Garza, Julio Rivera 2010: 7 students Rhiannon Chavez, LizandraSantillan, Michael Dozier, Michael Garza, Stephen Cantu, Antonio Martinez, Anthony Medellin
SAT • 2007 Seniors: 174 • 2008 Seniors: 203 • 2009 Seniors: 150 • 2010 Seniors: 220 • 2011 Seniors up to date: 204 with an additional 47 students to test on Jan. 22, 2011 • ACT • 2007:71 • 2008:69 • 2009:49 • 2010: 85 • 2011 up to date: 74 with an additional 31 students to test on Feb. 12, 2011