Download
1 / 22
220 likes | 322 Views
Overview Vermont Power Supply. University of Vermont January 27, 2004 Dave Lamont Vermont Public Service Department. Overview. Where are we? Utility structure Regional Context Vermont’s current power mix and needs Where are we going? Vermont’s future power needs

E N D
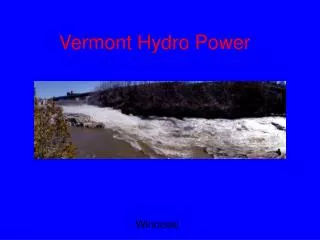
OverviewVermont Power Supply University of Vermont January 27, 2004 Dave Lamont Vermont Public Service Department
Overview • Where are we? • Utility structure • Regional Context • Vermont’s current power mix and needs • Where are we going? • Vermont’s future power needs • What might it look like when we get there? • Utility resource acquisition options • As usual, things are more complicated than they seem:
Vermont Electric Utility Structure • 22 Electric Utilities (Soon to be 21) • CVPS, Green Mountain Power, Citizens and Rochester Electric are IOU’s • WEC and VEC are Coops • 16 Municipal Utilities
Vermont Utility Structure • Vertically Integrated • Each guaranteed a geographic service territory • Obligation to Serve • Earn a reasonable rate of return • Subject to regulation • The Rest of New England is heading in a different direction
Vermont Participates in the Regional Marketplace www.iso-ne.com \ Data & Reports \ LMP Map
Vermont’s Electric Needs • 1,000 MW peak demand now • Growing at about 2 MW per year since 1992; 100 MW 1984-92 • 550 MW will need to be replaced in 2012- 2015 timeframe!! • Current Sources • Vermont Yankee - about 1/3 of annual demand and energy • Contract Expires 2012 • Hydro Quebec - about 1/3 of annual demand and energy • Contract expires from 2012 to 2020, most expiring in 2015 • Owned Renewables – 7-10% of energy • Independent Power Producers - about 10% demand and 5% energy • Contracts expire 2008 to 2020+ • Other sources - about 20% of energy
Positive steps: • Since 1984 peak demand in VT has risen by ~125 MW, allmet by new, in-state renewables • 40 MW - small hydro, IPP, WEC, GMP • 73 MW - McNeil and Ryegate wood chip plants • 6 MW - Searsburg wind project • small landfill gas projects – Brattleboro and Burlington • Vermont utilities’ energy efficiency efforts, including Efficiency Vermont, have saved over 80 MW of demand • Bottom line – current portfolio mix is very high in renewables, and America’s lowest in CO2 • BUT – VT still imports a large % of our electricity
Major Resource OptionsWhere Can We Go From Here? • Add Renewables • Imported Hydro (HQ or Lower Churchill) • Connecticut and Deerfield River Dams • Blended Balance • VT Yankee • Shift to Fossil Plants • New Cogen and Distributed Gen in VT • Efficiency and Load Management • Ride the Spot Market Different Solutions May be Viewed Differently by Each Utility
Other Resource Alternatives • Transmission • Exports the generation siting issue • Creates a new siting issue • Demand Side Resources • Energy efficiency • Demand response • Customer-sited generation • Can local resources avoid power lines?
Fuel prices, particularly Natural Gas Nuclear and Hydro conditions Load Growth Production Tax Credit CO2 Taxes Interest Rates Efficiency potential Old Approach Make one assumption for each area of uncertainty. Calculate a least-cost mix. New Risk Analysis Approach Calculate probability-weighted portfolio cost, volatility, and standard deviations; use judgment with final results. Lots of Uncertainty
Decision-making:Potential Benefits of Wind • Mitigates Fuel Price Risk • Reduces Natural Gas Prices • Reduces Wholesale Power Prices (through “bid stack effect”) • Displaces Emissions & Mitigates Future Environmental Compliance Risk • Promotes Local Economic Development • National and Global Contributions
But…Concerns • Is it a higher priced resource? • Intermittent resource – not reliable? • Can Vermont wind make a difference or would we be better doing something else? • Siting: electrical, aesthetic, and environmental impacts • Local economic harms?
How Would the Benefits of a Wind Project Flow Through to Ratepayers? • Depends on Ownership
All Types Generation Need Back Up Reliability Guidelines Dictate Operating Reserves at Any Particular Time Large Plants Require Most Reserves The Variability in Output from a Wind Turbine Installation is Insignificant Compared to the Variability in the Load Every KiloWatt-hour generated by a wind plant will offset generation from a fossil fueled plant Most Likely Located in New England Reliability and Wind Power
Looking at the state, Vermont needs to make a major commitment for new power sources before 2015 Some smaller utilities have more immediate needs From an energy planning point of view, there is no reason wind power can’t be an option The allocation of benefits and costs will depend on ownership Conclusions
The devil is in the details “But what if we do switch to gas, and then the cost goes through the roof?”
Questions for discussion • What do we want in the portfolio? • Not just wind v. gas & nukes • Wind, hydro, biomass, CHP, efficiency are all competing for our investment $ • Whose needs are we trying to meet? • Who is taking what risks? • Utility-based or market-based ? • Can we move to risk-based analysis? • Can we be creative with the siting process and community solutions?