Download
1 / 30
300 likes | 411 Views
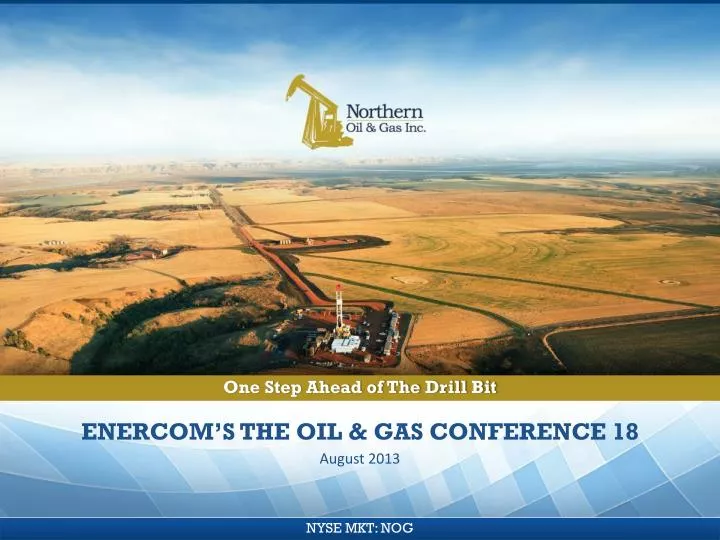
One Step Ahead of The Drill Bit. enercom’s The Oil & Gas Conference 18 . August 2013. Forward Looking Statements.

E N D
One Step Ahead of The Drill Bit enercom’s The Oil & Gas Conference 18 August 2013
Forward Looking Statements • Statements made by representatives of Northern Oil and Gas, Inc. (“Northern” or the “Company”) during the course of this presentation that are not historical facts are forward-looking statements. These statements are based on certain assumptions and expectations made by the Company which reflect management’s experience, estimates and perception of historical trends, current conditions, anticipated future developments and other factors believed to be appropriate. Such statements are subject to a number of assumptions, risks and uncertainties, many of which are beyond the control of the Company, which may cause actual results to differ materially from those implied or anticipated in the forward-looking statements. These include risks relating to crude oil and natural gas prices; the pace of drilling and completions activity on our properties, our ability to raise or access capital; general economic or industry conditions, nationally and/or in the communities in which the Company conducts business; changes in the interest rate environment; legislation or regulatory requirements; conditions of the securities markets; changes in accounting principles, policies or guidelines; financial or political instability; acts of war or terrorism; other economic, competitive, governmental, regulatory and technical factors affecting our operations, products and prices; and other important factors that could cause actual results to differ materially from those anticipated or implied in the forward-looking statements. Northern undertakes no obligation to publicly update any forward-looking statements, whether as a result of new information or future events.
CORPORATE PROFILE • Vital Statistics • Proved Reserves: • YE 2012 Proved Reserves 67.6 MMBoe • Production: (2nd Quarter 2013) • Averaged ~10,900 Boe/d • 90% Crude Oil • 1,438 Producing Wells (121.5 net) • 218 Wells Drilling (17.4 net) (1) • Position: • 182,400 net acres • 61% Held(2) • 71% Held in North Dakota • As of 6/30/13 • Held equals developed, held by production or held by operations.
Williston basin heritage The “Go To” Buyer of Non-Operated Bakken Acreage • Four Generations of Building Relationships in the Williston Basin • First-Mover advantage – low acreage costs, strong “all-in” returns • Leading non-op franchise in the Williston – the “first call” for sellers • Participated in some of the first Bakken wells • On-The-Ground Advantages • Strategic non-operated acreage acquisitions in the Bakken core • Relationships with leading operators
One step ahead of the drill bit Continued Expansion of Acreage Footprint and Multi-Year Drilling Inventory • Acquire Non-Operated Acreage On Verge of Development Drilling • Acquire high-potential acreage about to be drilled • Fast return of capital • Partnered with Leading Operators • Bakken/Three Forks - One of the top crude oil plays in North America • 25+ operating partners diversifies risk • Choose to participate with the best operators • Visible Growth Potential Over Long-Term • Extensive multi-year drilling inventory • Ability to continue acquiring non-op working interests • Stacked pay zones from Bakken and benches of the Three Forks makes effective acreage position larger than surface footprint
Value creation model Proven Business Model Converts Acreage Into Value in 180-240 Days(5) Creating Value One Step Ahead of The Drill Bit (1) Acquisition cost based on $1,057 per acre, 1280 acre spacing unit and 10% working interest. (2) Based on $8.9 million AFE (3) Reserves value based on End Ultimate Recovery estimate of 550MBoe valued at $29.64/Boe. Taking into consideration estimated total proved reserves (as of 12/31/2012) for OAS, CLR, WLL, KOG and HES, and enterprise values as of August 2, 2013. (4) Divides reserves value by sum of capital investment (acreage, and drilling and completion) – 1. (5) All values are net of average 10% working interest.
Repeatable EXECUTION = GROWTH Growth Track Record from Consistent Execution of Business Strategy Oil & Gas Revenue ($MM) (1) Adjusted EBITDA ($MM)(2) Proved Reserves (MMBoe) Total Book Capitalization ($MM) Source: SEC filings. As of 6/30/2013 includes realized gain/loss from hedging activity. See appendix for Adjusted ABITDA reconciliation.
High-Quality Acreage portfolio Foundation for Continued Growth and Value Creation Northern Net Acreage Summary Net Acres By County • Total Net Acreage: 182,400 (as of 6/30/2013) • ND: 143,244 Net Acres • MT: 39,156 Net Acres North Dakota Montana • Includes acreage classified as held by production, held by operations or developed.
Strengthening the Foundation, Multi-Year Growth Profile Growing the franchise
ACQUISITION MODEL • Buy Acreage “One Step Ahead of the Drill Bit” • Deep knowledge of the Williston Basin – 1,400+ gross producing wells • Good visibility on who the operators are, drilling plans, AFE costs and general economics prior to acreage acquisition • Acquire acreage already permitted and on operator’s development plan • Seek Non-Op Lease Positions Contiguous to Large Operator Positions • Reduce Acquisition-to-Value Creation Time • Manage capital outlays • Participate with operators we know • Purchase at Discount to Market • Low Entry Cost Enhances Returns
Continuous opportunity stream NOG is the “Go-To” Buyer of Non-Op Acreage in the Williston Basin
Acquisition track record • 182,400 net mineral acres in the Bakken / Three Forks play at June 30, 2013 • Average acreage acquisition price of $1,788 / acre in 2012 and $1,057 in Q2 2013 • Majority of acreage acquisitions involve properties that are “hand-picked” by Northern on a lease-by-lease basis • Northern has grown its percent of HBP/HBO Williston Basin acreage from ~3% in 2008 to ~61% in Q2 2013 (~71% in North Dakota) • Approximately $20 million in 2013 allocated to acreage acquisition
PARTNERED WITH LEADING OPERATORS • NOG participates in wells with most of the top operators in the Williston Basin Diversify Risk Among Active Drillers in the Williston Basin
Gross Bakken run rate capex for these 12 operators is estimated at ~$11 billion 86% of rigs in North Dakota are currently running in townships / ranges where Northern holds acreage Northern Acreage is Core to Premier Operators Total North Dakota Rigs (181)(1) North Dakota Rigs (181)(1) • NDIC North Dakota rig count as of August 7, 2013. Slawson rig count includes one rig in Montana. • Assumes one well per rig per month and $7.5 MM gross capex per well.
Our Operational Focus is Purely Bakken The Williston basin
Bakken Activity Continues to Grow North Dakota Active Horizontal Rig Count and Production(1) Daily Production (Mboe/d) Active Horizontal Rig Count North Dakota Wells Spud(1) North Dakota Monthly Wells Spud and Rig Count(1) Estimate Actual (2) NDIC Annualized figure based on actual data for the period between January and May 2013
MULTI-PlAY, MULTI-PAY Gamma Ray Resistivity Upper Three Forks Potential Increases Footprint • Middle BakkenTraditional Focus • Benches of Three Forks Opens New Resource Potential • Three Forks Increases Effective Acreage Position and Drilling Inventory Bakken Middle 11,300 Lower 1st Bench 11,400 Bakken Petroleum System 308’ 2nd Bench Three Forks 11,500 3rd Bench 4th Bench 11,600 (1) Charlotte 2-22H Log
Capital and Liquidity to Continue Growth Path Financial overview
leading Capital efficiency Northern Generated $3.50 in EBITDA for Each $1.00 Invested in F&D Capital Efficiency is calculated by dividing TTM EBITDA per TTM production (per Boe) by three-year finding and development cost per Boe. F&D Cost is cost incurred in oil and gas activities excluding abandonment, divided by the sum of extensions, discoveries, revisions and purchases of proved reserves over a 3-year period.
CAPITAL investments Acquisition and Development Investment Capital Shifting to Development $538.1 $414.0 $372 $198.5 $49.5 (1) Based on capital budget from August 2013
Liquidity – resources for growth Financial Resources to Stay One Step Ahead $295MM Surplus (Est) See Appendix for calculation of non-GAAP measured Adjusted EBITDA CapEx as stated August 2013
High cash operating margin Historical Cash Operating Margins per BOE (1) 2013 TTM Peer Cash Operating Margins per BOE (1) Average Realized Price of $69.74 per BOE Average Cash Operating Margin of $47.70 per BOE Realized Price is defined as oil, gas and NGL sales, including the effects of realized hedging gains or losses. Data as of 6/30/13. Cash Operating Margin is defined as oil and gas sales, including settled derivatives, less production expenses, production taxes and cash G&A.
Low costs + high margins = growth Northern Delivers Strong Fundamental Performance in Key Operational Metrics Three-Year F&D Cost 2010-2012 ($/Boe)(1) Cash Operating Margin TTM 6/30/2013 ($/Boe) Low Asset Intensity(2) = Cash Flow to Grow Three-Year Production Replacement (2010-2012) F&D Cost is cost incurred in oil and gas activities excluding abandonment, divided by the sum of extensions, discoveries, revisions and purchases of proved reserves over a 3-year period. Asset Intensity is calculated as TTM production multiplied by 3-year F&D cost per Boe all divided by TTM cash flow from operations.
Leading Performance at a value price EV / Proved Reserves (YE 2012) EV / Production (TTM Q2’13) As of 8/2/2013
Why northern today? One Step Ahead of the Drill Bit • Proven Acquisition Model – Acquire High-Potential Acreage About to be Drilled • Focused on the Bakken and Three Forks – A Premier Crude Oil Play in North America • Strong Well Economics • Deep Knowledge of the Bakken and Three Forks • “Go-To” Non-Op Acreage Buyer • Steady Deal Flow from Multiple Sources • Ample Liquidity to Fund AFE’s as well as Acquisitions • Partnered with Leading Operators in the Bakken • Partnered with the Bakken’s Best and Most Active Drillers • Strong Financial Foundation and Liquidity to Fund Growth • Visible Growth Potential • Extensive Multi-Year Drilling Inventory • Ability to Continue Acquiring Non-Op Working Interests • Rights to Multiple Zones, Multiple Depths
Northern oil and gas, inc. • APPENDIX: Supplemental Information
Cash operating margin reconciliation *Realized Price: Oil and gas sales, including effect of settled hedges, divided by total production (BOE).