Download
1 / 33
330 likes | 445 Views
By Michael Cochran-Boucher University of New Hampshire Manchester 2010 Spring, Undergraduate Research Symposium. Obesity AND Pregnancy: associated morbidities. Source: Fall 2009, Independent Study, Case Study: BMI and Pregnancy. Research Question:

E N D
By Michael Cochran-Boucher University of New Hampshire Manchester 2010 Spring, Undergraduate Research Symposium Obesity AND Pregnancy: associated morbidities Source: Fall 2009, Independent Study, Case Study: BMI and Pregnancy
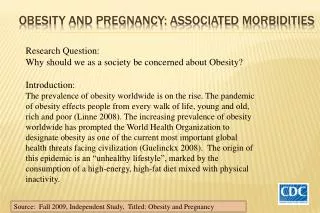
Research Question: • Why should we as a society be concerned about Obesity? • Introduction: • The pandemic of obesity effects people from every walk of life, young and old, rich and poor (Linne 2008). • The World Health Organization to designate obesity as one of the current most important global health threats facing civilization (Guelinckx 2008). • Unhealthy lifestyle marked by the consumption of a high-energy, high-fat foods mixed with physical inactivity (Guelinckx 2008). Obesity AND Pregnancy: associated morbidities Source: Fall 2009, Independent Study, Case Study: BMI and Pregnancy
Outline: • BMI methods and problems with collection. • BMI data for the United States since 1985. • Gestational diabetes, PCOS, metabolic imprinting as an infant are only a few related complications. • Overall figures derived from the case study research. • Finally, some difficulties in the health care billing and collection of data. Obesity AND Pregnancy: associated morbidities Source: Fall 2009, Independent Study, Case Study: BMI and Pregnancy
Self reporting of height and weight Body Mass Index (BMI): a measure of weight in relation to height = weight (kg) / height (m) Sq. X 703 Classification: Underweight: BMI < 18.5 Overweight: BMI 25.0-29.9 Obese: BMI > 30.0 How is obesity measured in adults? Morbidly Obese: BMI> 39.9 Source: www.Mass.gov
Obesity Trends* Among U.S. AdultsBRFSS, 1985 10%–14% No Data <10% *BMI ≥30, or ~ 30 lbs. overweight for 5’ 4” person. Source: U.S. Center for Disease Control (CDC)
Obesity Trends: Among U.S. AdultsBRFSS, 1986 10%–14% No Data <10%
Obesity Trends: Among U.S. AdultsBRFSS, 1987 10%–14% No Data <10%
Obesity Trends: Among U.S. AdultsBRFSS, 1988 10%–14% No Data <10%
Obesity Trends: Among U.S. AdultsBRFSS, 1989 10%–14% No Data <10%
Obesity Trends: Among U.S. Adults BRFSS, 1990 10%–14% No Data <10%
Obesity Trends: Among U.S. AdultsBRFSS, 1991 No Data <10% 10%–14% 15%–19%
Obesity Trends: Among U.S. AdultsBRFSS, 1992 No Data <10% 10%–14% 15%–19%
Obesity Trends: Among U.S. AdultsBRFSS, 1993 No Data <10% 10%–14% 15%–19%
Obesity Trends: Among U.S. AdultsBRFSS, 1994 No Data <10% 10%–14% 15%–19%
Obesity Trends: Among U.S. AdultsBRFSS, 1995 No Data <10% 10%–14% 15%–19%
Obesity Trends: Among U.S. AdultsBRFSS, 1996 No Data <10% 10%–14% 15%–19%
Obesity Trends: Among U.S. AdultsBRFSS, 1997 No Data <10% 10–14% 15–19% ≥20%
Obesity Trends: Among U.S. AdultsBRFSS, 1998 No Data <10% 10–14% 15–19% ≥20%
Obesity Trends: Among U.S. AdultsBRFSS, 1999 No Data <10% 10–14% 15–19% ≥20%
Obesity Trends: Among U.S. AdultsBRFSS, 2000 No Data <10% 10–14% 15–19% ≥20%
Obesity Trends: Among U.S. AdultsBRFSS, 2001 No Data <10% 10%–14% 15%–19% 20%–24% ≥25%
Obesity Trends: Among U.S. AdultsBRFSS, 2002 No Data <10% 10%–14% 15%–19% 20%–24% ≥25%
Obesity Trends: Among U.S. AdultsBRFSS, 2003 No Data <10% 10%–14% 15%–19% 20%–24% ≥25%
Obesity Trends: Among U.S. AdultsBRFSS, 2004 No Data <10% 10%–14% 15%–19% 20%–24% ≥25%
Obesity Trends: Among U.S. Adults BRFSS, 2005 ≥30% No Data <10% 10%–14% 15%–19% 20%–24% ≥25%
Obesity Trends: Among U.S. AdultsBRFSS, 2006 ≥30% No Data <10% 10%–14% 15%–19% 20%–24% ≥25%
Obesity Trends: Among U.S. AdultsBRFSS, 2007 ≥30% No Data <10% 10%–14% 15%–19% 20%–24% ≥25%
Obesity Trends: Among U.S. AdultsBRFSS, 2008 ≥30% No Data <10% 10%–14% 15%–19% 20%–24% ≥25%
Obesity Trends: Among U.S. Adults1990, 1999, 2008 1999 1990 2008 No Data <10% 10%–14% 15%–19% 20%–24% ≥25% ≥30%
BRFSS, Behavioral Risk Factor Surveillance System http: //www.cdc.gov/brfss/ • Mokdad AH, et al. The spread of the obesity epidemic in the United States, 1991—1998 JAMA 1999; 282:16:1519–22. • Mokdad AH, et al. The continuing epidemics of obesity and diabetes in the United States. JAMA. 2001; 286:10:1519–22. • Mokdad AH, et al. Prevalence of obesity, diabetes, and obesity-related health risk factors, 2001. JAMA 2003: 289:1: 76–9 • CDC. State-Specific Prevalence of Obesity Among Adults — United States, 2007; MMWR 2008; 57(36);765-8 Citations
Definitions: • Obesity: Body Mass Index (BMI) of 30 or higher. • Body Mass Index (BMI): A measure of an adult’s weight in relation to his or her height, specifically the adult’s weight in kilograms divided by the square of his or her height in meters. Obesity Trends Among U.S. Adults between 1985 and 2008
Source of the data: • The data shown in these maps were collected through CDC’s Behavioral Risk Factor Surveillance System (BRFSS). Each year, state health departments use standard procedures to collect data through a series of telephone interviews with U.S. adults. • Prevalence estimates generated for the maps may vary slightly from those generated for the states by BRFSS (http://aps.nccd.cdc.gov/brfss) as slightly different analytic methods are used. Obesity Trends Among U.S. Adults between 1985 and 2008
In 1990, among states participating in the Behavioral Risk Factor Surveillance System, ten states had a prevalence of obesity less than 10% and no states had prevalence equal to or greater than 15%. • By 1999, no state had prevalence less than 10%, eighteen states had a prevalence of obesity between 20-24%, and no state had prevalence equal to or greater than 25%. • In 2008, only one state (Colorado) had a prevalence of obesity less than 20%. Thirty-two states had a prevalence equal to or greater than 25%; six of these states (Alabama, Mississippi, Oklahoma, South Carolina, Tennessee, and West Virginia ) had a prevalence of obesity equal to or greater than 30%.