Download
1 / 18
180 likes | 276 Views
CITY OF ST. LOUIS EARNINGS TAX DISCUSSIONS WAYS AND MEANS COMMITTEE MARCH, 2010. Revenue Structure. Typical of most large municipalities, City revenues are comprised of a mix of taxes, licenses and fees. Earnings Tax - $138.4M Property Taxes - $51.1M Sales Taxes - $48.0M

E N D
CITY OF ST. LOUIS EARNINGS TAX DISCUSSIONS WAYS AND MEANS COMMITTEE MARCH, 2010
Revenue Structure Typical of most large municipalities, City revenues are comprised of a mix of taxes, licenses and fees.
Earnings Tax - $138.4M Property Taxes - $51.1M Sales Taxes - $48.0M Payroll Tax - $35.5M Franchise (Utility) Taxes - $61.4M Service Fees - $18.5M Intergovernmental Aid - $18.4M Sources of General Revenue (actual FY09) Revenue Structure
Revenue Structure • Goal of revenue structure is to maintain a diverse base that grows with economy at a rate sufficient to maintain City services
Revenue Structure • Desirable characteristics for individual revenues include: o Equity and fairness: (e.g. not imposed most heavily on those least able to pay, incurred by users of services, residents and non-residents, etc..) o Ability to grow with economy o Reasonableness in relation to impact on economic activity o Ease of enforcement and collection
Revenue Structure • Over 70% of City general revenue is distributed among five top sources • Each has strengths and weaknesses in meeting desirable characteristics • Collectively represents a diverse base that grows modestly with economy and distributes tax burden among those that benefit from City services
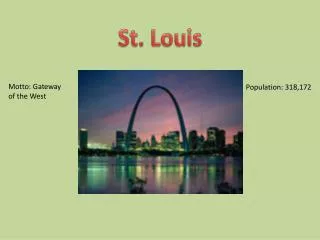
Revenue Structure City Services Have a Regional Reach • Home to major sports venues, Busch Stadium, Edward Jones Dome, Scottrade Center • Arch and Riverfront • Forest Park • Zoo / Art Museum / History Museum / Science Center and Botanical Garden • Grand Center and other performing art venues • Convention Center
City Earnings Tax • Imposed in 1959 • Individual tax of 1% of earnings of residents and non-residents of the City for work done or for services performed in the City • Corporate tax of 1% of net business profits from City businesses or business conducted in the City
City Earnings Tax • Individual earnings tax equal to approx. 85% of total earnings tax receipts
Other Major Cities Imposing Earnings and/or Income Taxes: Baltimore Cincinnati Cleveland Columbus Denver Louisville Kansas City New York Pittsburgh Philadelphia City Earnings Tax
City Earnings Tax • Growth rate over 3 year, 5 year and 10 year period less than property tax but more than sales taxes. Growth Rates 3yr. 5yr. 10yr. Earnings Tax 1.7% 2.7% 1.9% Property Tax 4.5% 3.4% 2.8% Sales Tax 0.5% 1.4% 0.2%
City Earnings Tax • As the largest source of general revenue ($138.4M in FY09) the earnings tax provides the most funds for City services. • Equivalent to: o Just over the FY09 total general fund costs of the Police Dept. @ $137.3M
City Earnings Tax • Or Equivalent to the costs of these services: o Fire Department - $61.1M o Corrections - $35.7M o Refuse Department - $13.5M o Forestry Div. trimming / weed & debris - $7.1M o Park Maintenance - $8.5M o Building Code Enforcement - $7.7M o Street and Alley Lighting - $5.0M
Property Tax As Replacement? • Est. Earnings Tax Receipts (FY10rev) (A) $136,000,000 • Estimated Property Tax Revenues (B) $287,573,759 (incl. City, schools, library, zoo/museum, etc..) • City Property Tax Rate* per $100 AV (C) $6.6465 *City portion (excl. debt) = $1.279 • Additional Rate to Compensate for Earnings Tax A / (B/C) = $3.143 • Would exceed current statutory cap – City portion of $1.279 at 86% of $1.49 limit
Property Tax As Replacement? Business Homeowner #1 Homeowner #2
Sales Tax As Replacement? • The sales tax is similarly restricted as City’s current rate reflects most sales tax options • Historically weak growth rate
Other Considerations • Credit risks related to uncertainties in revenue stream and continued need to reauthorize tax (higher borrowing costs?) • Impact on financed TIF developments • Current budget challenges