Download
1 / 18
230 likes | 386 Views
IBM Information Server. Understand - Information Analyzer. IBM Information Server Delivering information you can trust. Support for Service-Oriented Architectures. Transform. Deliver. Understand. Cleanse. Discover, model, and govern information structure and content. Standardize, merge,

E N D
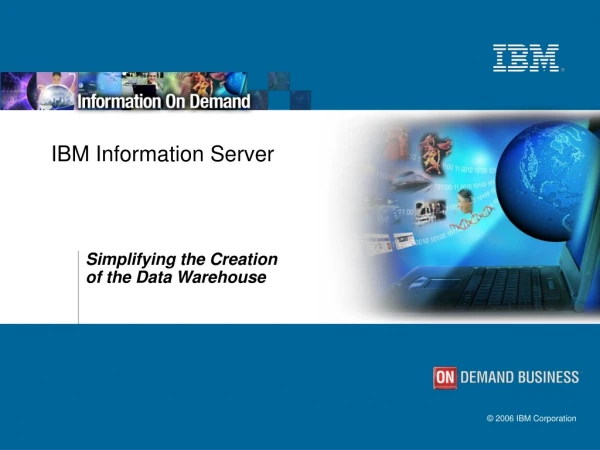
IBM Information Server Understand - Information Analyzer
IBM Information ServerDelivering information you can trust Support for Service-Oriented Architectures Transform Deliver Understand Cleanse Discover, model, and govern information structure and content Standardize, merge, and correct information Combine and restructure information for new uses Synchronize, virtualize and move information for in-line delivery Platform Services Parallel Processing Administration Deployment Connectivity Metadata
The IBM Solution: IBM Information ServerDelivering information you can trust IBM Information Server Unified Deployment Transform Deliver Understand Cleanse Information Analyzer Data profiling for understanding what data you have and how it relates to other data, plus data analysis for measuring and monitoring ongoing data quality. Unified Metadata Management Parallel Processing Rich Connectivity to Applications, Data, and Content
Critical Problems: You don’t know what data is really in your legacy systems Sources have changed or are new and unknown Why? Data values and relationships are inconsistent and divergent from documented rules Incomplete and missing documentation Data sources are never static and frequently change without warning Alternative Approach Labor intensive, resource devouring process Never review 100% of data elements No infrastructure to support maintenance No standardized approach across projects 1st generation tools document but don’t address the problem resolution Data Sources ERP from acquisition Mainframe manufacturing system Parts BOM External Lists Distribution Demographic Contact Billing / Accounts Data Profiling
Automates your data discovery process Enables you to understand your data before starting development Eliminates the risk and uncertainty of using bad data Useful in any type of data migration project Analyzes every data attribute and reverse engineers the true meta data of your source Reduces time to analyze data Data Sources ERP from acquisition Mainframe manufacturing system Parts BOM External Lists Distribution Demographic Contact Billing / Accounts About Information Analyzer
IBM Information Analyzer • Reduce Time to Value of Data Projects • Increase the Productivity of Data Personnel • Assess Data Quality & Consistency across the Enterprise • Results sharable across IBM Information Server Data Profiling: the process of analyzing a data sources to determine its content, quality and structure
What does Information Analyzer provide? • Source System Analysis • Provides the key understanding of the source data • Column & Domain analysis • Table/Primary Key analysis • Foreign Key analysis • Cross-Domain analysis • Iterative Analysis • Leverages the analysis to facilitate iterative tests • Baseline analysis Primary Key Analysis Column Analysis Source 2 Source 1 Foreign Key & Cross-Domain Analysis
Source System Analysis • Column & Domain analysis • Infers from content a column’s classification, physical properties, and frequency distribution • Table/Primary Key analysis • Validates the uniqueness of the identified key column, which allows us to ensure that a given row of data can be clearly identified and related to other data • Cross-Domain & Foreign Key analysis • Syncronizes the structure, relationships and integrity of data environments by finding and validating otherwise unknown relationships and identifying critical integrity violations that need to be rectified.
Column Analysis: Chart View • Frequency Distribution • View Frequency Distribution either in Tabular or in Graph • Add user defined value to Frequency Distribution • Generate Reference Tables • Sort and Filter Frequency Data
Column Analysis: Properties • Properties • Six property values are inferred for each column: Data Type, Length, Precision, Scale, Nullability and Cardinality Type. • Distribution of data types, lengths, precisions and scales is displayed graphical.
Primary Key Analysis Results • Reviewing Duplicates • View Summary of Distinct and Duplicated Values • Display list of all Primary Key values and #/% Duplicated.
Baseline Analysis • Baseline Differences • Detailed results for the column level. • Results include the column level summaries of distinctions for both Structure (Defined and Inferred) and Content.
ROI: Food Distribution. • Company Facts : • Largest distributor in North America • Four major acquisitions in last two years • 12,000 branded products • 30,000 clients • 11 operating centers Project Goals Challenges Results Integration of supply chain management systems Profit margin analysis systems Field expansion, and take along project Staff changes and limited documentation related to acquired systems Only 7% of data being analyzed, but bad data causing 20% of cost overruns Estimate 10k hours and $650kin costs to support first four projects 80% productivity gain for analyzing data sources $504,000 annual savings in lower development and maintenance costs Repeatable process for all future projects that ensures good, actionable data
ROI: Top US Life Insurance Company Company Facts : • #1 Largest Life Insurance Company in USA • 138US$ billion in assets under management • Offer complete like of life insurance, investment, retirement and related products Project Goals Challenges Results Competitive pressures requires the company to further enhance an existing competitive advantage – 360 degree customer view and 24\7 data availability. . Better customer visibility. Reduced costs by eliminating expensive and time-consuming investigations of detailed data. Redeploying an investigator saves $130k annually. Detailed customer data resided in ten disparate legacy systems with little to no documentation. Presenting raw detailed data 24\7 was impossible. Leveraging IBM allows for consistent data formats, validate data domains, define business rules linking policy data.