Download
1 / 23
230 likes | 348 Views
Early Experience Prototyping a Science Data Server for Environmental Data. Catharine van Ingen (et al), MSFT Microsoft eScience Workshop, Johns Hopkins University 13 October 2006. Outline. Background Data archives and other sources Typical small group collaboration needs

E N D
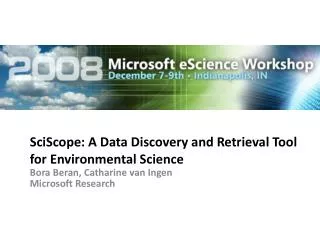
Early Experience Prototyping a Science Data Server for Environmental Data Catharine van Ingen (et al), MSFT Microsoft eScience Workshop, Johns Hopkins University 13 October 2006
Outline • Background • Data archives and other sources • Typical small group collaboration needs • Berkeley Water Center and Ameriflux collaboration • Science Data Server • Goals and capabilities • Approach • Lessons Learned
Large Models Local Measurements Typical Data Flow Today • Prior to analysis, data and ancillary data are must be assembled, checked, and cleaned • Some of this is mundane (eg unit conversions) • Some requires domain-specific knowledge including instrumentation or location knowledge • Ancillary data is often critical to understanding and using the data • After all that, data are often misplaced, scattered, and even lost • Provenance is in the mind of the beholder • “Everybody knows” yet no one is sure Internet Data Archives Legacy Sources
Internet Data Archives Large Models Local Measurements Legacy Sources Improved Data Flow • Local repository for data and ancillary data assembled by a small scientific collaboration from a wide variety of sources • A common “safe deposit box” • Versioned and logged to provide basic provenance • Simple interactions with existing and emerging internet portals for data and ancillary data download, and, over time, upload • Simplify data assembly by adding automation for tracking and data conversions
Ameriflux Collaboration Overview 149 Sites across the Americas Each site reports a minimum of 22 common measurements. Communal science – each principle investigator acts independently to prepare and publish data. Second level data published to and archived at Oak Ridge. Total data reported to date on the order of 150M half-hourly measurements. http://public.ornl.gov/ameriflux/ 6
T SOIL T AIR Onset of photosynthesis Water and Environmental Monitoring Catharine van Ingen Assembling and cleaning data from many different sources is the first big challenge Existing water and environmental data are piecemeal due to many contributing disciplines and organizations Lots of (small) (perhaps cleaned) data on the internet; individual users accesses a very small subset Site ancillary data often crucial, but not generally downloadable Once assembled, the data need to be assessed for applicability and validity Then browsing for science can begin What’s going on at higher latitudes? (It should be getting colder) Measurements per Month Data is often missing in the winter! Time reporting shift: average air temperature at nearby sites Example Carbon-Climate Investigations • Effects of early spring on carbon uptake • Role of vegetation, climate, and latitude on carbon flux • Effect of airplane groundings after 9/11 on atmospheric carbon • Linkages to remote sensing and other data sets just beginning T SOIL T AIR Onset of photosynthesis
Soils Climate Remote Sensing Observatory datasets Spatially continuous datasets Example Carbon-Climate Datasets
Scientific Data Server Goals • Act as a local repository for data and metadata assembled by a small group of scientists from a wide variety of sources • Simplify provenance by providing a common “safe deposit box” for assembled data • Interact simply with existing and emerging internet portals for data and metadata download, and, over time, upload • Simplify data assembly by adding automation • Simplify name space confusion by adding explicit decode translation • Support basic analyses across the entire dataset for both data cleaning and science • Simplify mundane data handling tasks • Simplify quality checking and data selection by enabling data browsing
Scientific Data Server Non-Goals • Replace the large internet data source sites • The technology developed may be applicable, but the focus is on the group collaboration scale and usability • Very large datasets require different operational practices • Perform complex modeling and statistical analyses • There are a lot of existing tools with established trust based on long track records • Only part of a full LIMS (laboratory information management system) • Develop a new standard schema or controlled vocabulary • Other work on these is progressing independently • Due to the heterogeneity of the data, more than one such standard seems likely to be relevant
Databases • All data and descriptive or ancillary data held in relational databases • While separate databases are shown, the datasets may actually reside in a single database • Mapping is transparent • Separate databases used for performance • Unified databases used for simplicity • New data and ancillary data are staged with a temporary database • Minimal quality checks applied • All name and unit conversions • Data may be exported to flat file, copied to a private MyDb database, directly accessed programmatically, or ?
Database Schema Subset • Two level versioning maps to actual data usage and data sourcing • Bound into a dataset version with spline filter • Only the dataset flows to the datacube • Ancillary data handled like data • Active over a time range • Numeric or text • Flows to the data cube as site attribute or time series data
Data Cubes • A data cube is a database specifically for data mining (OLAP) • Initially developed for commercial needs like tracking sales of Oreos and milk • Simple aggregations (sum, min, or max) can be pre-computed for speed • Additional calculations (median) can be computed dynamically • Both operate along dimensions such as time, site, or datumtype • Constructed from a relational database • A specialized query language (MDX) is used • Client tool integrations is evolving • Excel PivotTables allow simple data viewing • More powerful charting with Tableaux or ProClarity (commercial tools) • Browsing with SQL Report Server
Internet Data Archives Large Models Local Measurements Legacy Sources Server Workflows • Staging: adding data or metadata • New downloaded or field measurements added • New derived measurements computed • Editing: changing data or metadata • Existing older measurements re-calibrated or re-derived • Data cleaning, gap-filling or other algorithm changes • Sharing: making the latest acquired data available rapidly • Even before all checks completed • Browsing new data before more detailed analyses • Private Analysis: Supporting individual researchers (MyDB) • Stable location for personal calibrations, derivations, etc • Import/Export to analysis tools and models • Curating: data versioning and provenance • Simple parent:child versioning to track collections of data used for specific uses
Data Staging Pipeline • Data can be downloaded from internet sites regularly • Sometimes the only way to detect changed data is to compare with the data already archived • The download is relatively cheap, the subsequent staging is expensive • New or changed data discovered during staging • Simple checksum before load • Chunk checksum after decode • Comparison query if requested • Decode stage critical to handle the uncontrolled vocabularies • Measurement type, location offset, quality indicators, units, derivation methods often encoded in column headers • Incremental copy moves staged data to one or more sitesets • Automated via siteset:site:source mapping
Browsing for Data Availability Total Data Availability by Site Colored by Type Sites report more data either because of longevity or specific research interests
Browsing for Data Availability Data Availability by Site Measuring temperature is easy; deriving ecosystem production problematic
Browsing for Data Quality • Real field data has unit and time scale conversion problems • Sometimes easy to spot in isolation • Sometimes easier to spot when comparing to other data • Browsing data values can give rapid insight into how the data can be used before more complex analyses are performed Maximum Annual Air Temperature Global Warming or Reporting in Fahrenheit? Average Air Temperature at Two Nearby Sites Local time or GMT time? Odd Microclimate Effects or Error in Time Reporting ?
Browsing for Data Applicability • Real field data has both short term gaps and longer term outages due to instrument outages • The utility of the data depends on the nature of the science being performed • Browsing data counts can give rapid insight into how the data can be used before more complex analyses are performed What’s going on at higher latitudes? (It should be getting colder) Data often missing in the winter! Data Count
Lessons Learned To Date (1/2) • Ancillary data is as important as data • Comparing sites of like vegetation, climate as important as latitude or other physical quantity • Only some are numeric, most are debated, some vary with time • Curate the two together • Controlled vocabularies are hard • Humans like making up names and have a hard time remembering 100+ names • We’ve seen over 1000 column headings from the ORNL Ameriflux site and the names have changed over time • Assume a decode step in the staging pipeline • Data analysis and data cleaning are intertwined • Data cleaning is always on-going • Some measurements can be used as indicators of quality of other measurements • Share the simple tools and visualizations
Lessons Learned To Date (2/2) • There are at least three database schema families and two cube construction approaches • Everyone has a favorite • Each has advantages and disadvantages • Automate the maintenance and use the right one for the right job • Visual programming tools are great for prototyping • But debugging and maintenance can hit a wall • It’s easy to overbuild – use when “good enough” • There are at least three different visualization needs • Browsing and careful charting each have their place • Viewing very large (1M datapoints) datasets takes care in both the rendering and the query • Integrate with client tools, target server tools for browsing The saga continues at http://dsd.lbl.gov/BWC/amfluxblog/ and http://research.microsoft.com/~vaningen/BWC/BWC.htm
Acknowledgements Berkeley Water Center, University of California, Berkeley, Lawrence Berkeley Laboratory Deb Agarwal Monte Good Susan Hubbard Matt Rodriguez Yoram Rubin Microsoft Jim Gray Tony Hey Dan Fay Stuart Ozer SQL product team Ameriflux Collaboration Dennis Baldocchi Beverly Law Gretchen Miller Tara Stiefl Mattias Falk Tom Boden