Download
1 / 31
310 likes | 391 Views
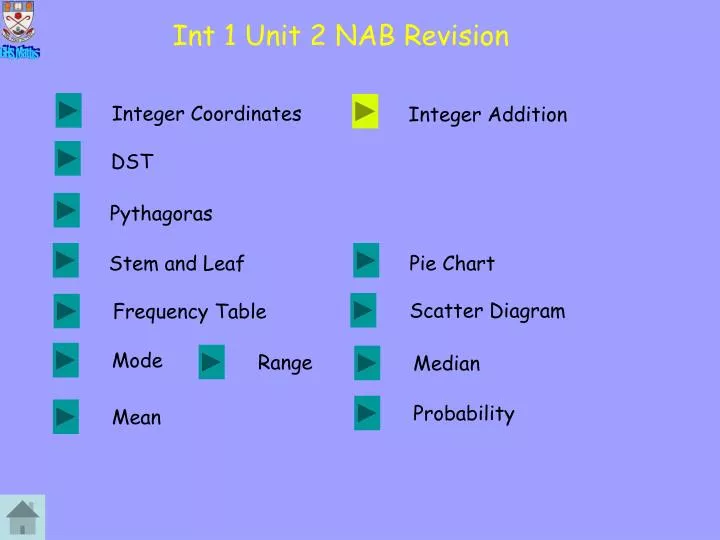
Int 1 Unit 2 NAB Revision. Integer Coordinates. Integer Addition. DST. Pythagoras. Stem and Leaf. Pie Chart. Scatter Diagram. Frequency Table. Mode. Range. Median. Probability. Mean. y. 6. 5. 4. 3. 2. 1. -6. -5. -4. -3. -2. -1. 1. 2. 3. 4. 5. 6. x. -1. -2. -3.

E N D
Int 1 Unit 2 NAB Revision Integer Coordinates Integer Addition DST Pythagoras Stem and Leaf Pie Chart Scatter Diagram Frequency Table Mode Range Median Probability Mean
y 6 5 4 3 2 1 -6 -5 -4 -3 -2 -1 1 2 3 4 5 6 x -1 -2 -3 -4 -5 -6 Integer Coordinates What are the coordinates of the point C A B 4 - 3 - 4 ( -2 ) 5 0 , A C B Start at the centre and decide whether to go left - or right + Point is below centre so x coord is 0 Is the point above + or below - Is the point above + or below - Is the point above + or below -
y 6 5 4 3 2 1 -6 -5 -4 -3 -2 -1 1 2 3 4 5 6 x -1 -2 -3 -4 -5 -6 Where is the Point Where is the point ( ) P - 5 , - 2 ( ) Q 0 , -3 ( ) R 3 , -5 P Q R As x is 0 the point will be either above or below the centre
5 A( ) Click Coordinates 4 , B( ) 4 -1 , C( ) 5 3 -4 , 4 D( ) -4 3 -1 , 2 E( ) 0 3 , 1 F( ) -1 -2 0 -4 1 -3 -5 2 -5 3 4 , -1 -2 G( -2 -5 ) , -3 0 H( ) -5 -4 , -5 I( 0 ) 4 , “Touch” the correct point J( ) -3 -1 , Start
Adding Integers Scores are for a quiz. 1 pt for correct answer. 1 pt deducted if answer is incorrect. Totals are added -2 -2 Jill scores ( - 4 ) + ( -3 ) + 5 = ( - 7 ) + 5 = Add negatives together then positives ( -4 ) + ( - 3 ) = ( - 7 )
Fred’s Score Scores are for a quiz. 1 pt for correct answer. 1 pt deducted if answer is incorrect. Totals are added 2 -2 = 5 + ( - 3 ) = = 2 Fred scores 5 + ( -1 ) + ( -2 ) There are two negatives ( - 1 ) is 1 down; ( - 2) is 2 down so ( -1 ) + ( -2 ) = 5 + ( - 3 ) is 5 up then 3 down - 3
Kevin’s Score Scores are for a quiz. 1 pt for correct answer. 1 pt deducted if answer is incorrect. Totals are added 1 -5 -2 - 5 = ( - 7 ) + 2 = Kevin scores ( - 3 ) + 2 + ( - 4 ) - 7 Cover up the 2 … work out ( - 3 ) + ( - 4 )
Integer Practice = ( -3 ) 6 ( -2 ) + (a) + = ( -6 ) ( -3 ) 10 + + (b) = ( -5 ) ( -2 ) 11 + + (c) = ( -3 ) 5 ( -7 ) + + (d) = 2 ( -4 ) ( -3 ) + + (e) x ÷ (-) √ C ² On + - 5 6 7 8 9 Next 0 . = 0 1 2 3 4 Ans
Slope indicates speed Slower Stopped Distance Fast Time
Interpreting a graph Distanc Time Graph Distance – Time Graph 200 Crawley 160 120 D C Sandford Distance (km) B 80 Barnstow 40 A Leigh 1100 1000 0900 0800 0700 Time (hours) Slope is not as steep as AB so travelling slower Horizontal. Stopped at Barnstow for 1 hour C Leave Barnstow as 0900 B … At 0800 arrive at Barnstow 80 km from Leigh Leaves Leigh at 07 00
Finding Distance Speed= m/s 15 15 Time = sec 12 12 D D = S x T D= 15 x 12 S T X = 180 miles X Can find distance
What is the Speed S = D ÷ T 375 D S = 375 ÷ 5 ÷ ÷ T x S 75 S= x 5 min hr T= hr min km D= 375 S= km/hr 5 hr T=
How long is the journey T = D ÷ S 88 D T = 88 ÷ 44 ÷ ÷ T x S 2 T= x 44 min hr T= hr min km S= 44 km/hr hr D= 88 T=
Pythagoras a= When you have both sides of the right angle you ADD the squares b= 22.4 3 22.4 3 c² = a² + b² Use c c²= a² + b² = c²= 0 c= = (-) On Ans C ² √ Opposite of ² is √ x 7 8 9 4 5 6 ÷ 1 2 3 - Start Next 0 . = +
Stem and Leaf 0 4 0 7 2 5 67 79 50 54 7 2 8 7 1 6 50 68 92 62 52 96 67 9 3 8 57 7 73 94 61 84 4 7 6 8 87 86 92 78 9 2 6 4 2 is 50 0 5 Key 92 represented by leaf 2 in level 9 Level 7 contains 79, 73 and 78 Each row is called a level A key must be included so that the data can be interpreted
Pie Chart A Pie chart is used to compare categories which can be chosen from BBC1 other STV This pie chart compares the channels 80 pupils watched at 8pm one evening SKY Which was the most popular SKY 90° The small square indicates that the angle for BBC is ¼ of the pupils were watching BBC 1 ¼ of 80 = 80 ÷ 4 = 20
lI lIl 58 56 59 57 60 56 62 60 58 60 58 59 lIll lIll 57 59 56 59 57 58 60 59 61 58 59 62 lIII lIII lIII lIII lIII lIII lI 60 58 60 59 59 60 59 61 59 60 62 59 61 58 60 61 59 58 57 62 59 61 58 60 lI Frequency Table 7 3 9 9 8 5 7 The last diameter to be entered is 60 The tally marks are then counted
ScatterGraph Draw a line of BEST FIT 32 28 24 Sales of Hot Soup 20 16 12 8 4 0 0 5 10 15 20 25 30 35 Temperature °C Temperature °C A scattergraph shows the connection between two quantities On the 3nd March the temperature was 5° and 28 cups were sold On the 2nd March the temperature was 8° and 20 cups were sold 24 bowl of soup were sold on March 1st when the temperature was 5°
Line of Best Fit Draw a line of BEST FIT Sales of Hot Soup Temperature °C The Scattergraph shows a connection between the temperature outside and the cups of Hot Soup sold The line shows roughly where the point are. Some above. Some below.
Using a Best Fit Line How many bowls when temperature is 5°C Sales of Hot Soup Temperature °C Once the line is drawn you do not need the points. The line shows the connection ( correlation ) between temperature and sales. For a temperature of 5° about 25 bowls would be sold Estimate how many bowls of soup would be sold when the temperature is 20°C. 9 bowls sold
Line of Best Fit Draw a line of BEST FIT Sales of Hot Soup Temperature °C Bowls of Soup 16 Temperature x ÷ (-) √ C ² On + - 5 6 7 8 9 Next Temperature Start 0 . = 0 1 2 3 4 Ans
Statistics … Mode 2 7 11 11 2 12 12 17 16 14 4 2 20 8 Sort 1 1 10 13 14 19 20 9 10 14 16 16 16 19 Mode is the number which there is MOre of 1 Mode = To find the median the data needs to be in order. It is easier to find the Mode and the Range if the data is in order x ÷ (-) √ C ² On + - 5 6 7 8 9 0 . = 0 1 2 3 4 Ans New Data
Finding the Range The range is the difference between the highest number and the lowest number. 20 10 25 30 8 10 - High Low Range = - = = x ÷ (-) √ C ² On + - 5 6 7 8 9 Next 0 . = 0 1 2 3 4 Ans
Median The MEDIAN of data is the middle value when put in order. 5, 7, 7, 10, 14, 16, 16, 18 8 ÷ 2 = 4 There are 8 values. Split into two equal groups of four 5 , 7 , 7 , 10 , 14 , 16 , 16 , 18 No number in the middle so find the number halfway between 10 and 14 24 10 + 14 24 ÷ 2 = 12 = Median = = 2 2
What is the Median 5 3 9 19 9 17 7 16 7 2 9 9 7 5 Sort 3 5 9 9 17 19 19 9 9 11 13 16 19 20 3 Can have two groups of ( 9 + 9 ) ÷ 2 Working 9 Median = x ÷ (-) √ C ² On + - 5 6 7 8 9 0 New Data . = 0 1 2 3 4 Ans
Find the Median 11 3 20 14 1 12 3 Sort 1 3 3 11 12 14 20 Split into two groups of 3 Working Median = x ÷ (-) √ C ² On + - 5 6 7 8 9 New Data 0 . = 0 1 2 3 4 Ans
Mean of 4 numbers 17 16 10 29 Total Mean = How Many Total 29+17+16+10 = Mean How Many 4 72 4 ÷ = 18 =
Mean of 6 numbers 11 19 22 26 22 26 Total Mean = How Many Total 26+11+19+22+26+22 = Mean How Many 6 126 6 ÷ = 21 =
Probability Favourable 1 2 Probability= 3 16 Possible 15 4 Probability of a 9 1 Favourable 14 5 P(9) = 16 Possible 13 6 16 different numbers are possible with this spinner 7 12 8 11 9 Only one position will win when the spinner stops at 9 10 Win
Probability What is the Probability of getting a four on the throw of a dice Favourable P(4) = Possible Possible Possible outcomes 6 Favourable outcome 1 1 Favourable
0 (-) On Ans C ² √ x 7 8 9 x ÷ (-) √ C ² 4 5 6 ÷ On + - 5 6 7 8 9 1 2 3 - 0 . = 0 1 2 3 4 Ans 0 . = +