Download
1 / 37
380 likes | 442 Views
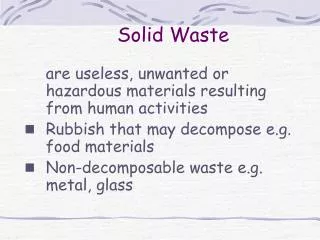
ASTSWMO State Solid Waste Managers Conference. Life Cycle Thinking and Solid Waste: A State’s Perspective August 13, 2007 David Allaway, Oregon Department of Environmental Quality (503) 229-5479 allaway.david@deq.state.or.us. Tom McCall Governor of Oregon, 1967-1975.

E N D
ASTSWMO State Solid Waste Managers Conference Life Cycle Thinking and Solid Waste: A State’s Perspective August 13, 2007 David Allaway, Oregon Department of Environmental Quality (503) 229-5479 allaway.david@deq.state.or.us
Tom McCall Governor of Oregon, 1967-1975 “Come visit us again and again . . . but for heaven’s sake, don’t come here to live.” (January 1971, Interview with Terry Drinkwater, CBS News) 2
Three Examples of Life Cycle Analysis Applied to Solid Waste • Oregon Governor’s Advisory Group on Global Warming • Energy Benefits of Recycling • DEQ E-Commerce Packaging Study
EPA Climate Change and Waste Resources: Report: http://epa.gov/climatechange/ wycd/waste/ SWMGHGreport.html WARM and other tools: http://epa.gov/climatechange/ wycd/waste/tools.html 5
Oregon Greenhouse Gas Emissions Inventory, 2000 (Conventional Accounting) California/LBL Greenhouse Gas/Product Life Cycles (2004) Other 14% Solid Waste Disposal 1% Electricity 36% Other Fossil Fuels 17% Transportation 32% 6
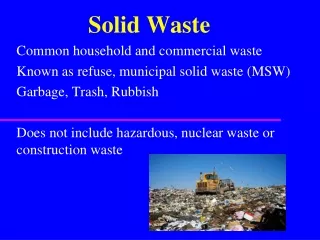
Key Findings: Global Warming • Conventionally, landfills and incinerators contribute ~1% of Oregon’s greenhouse gas emissions. • But “upstream” (production-related) emissions of these materials are ~10 times higher (possibly more). • Greenhouse gas benefits of prevention and recycling are primarily “upstream”
Key Findings: Global Warming(continued) • Conventional accounting/inventories mask the full impact of materials • Upstream emissions are spread across other categories (industrial energy use, transport) • Many emissions aren’t even accounted for (out-of-state and foreign production) • 1997: net embodied CO2 emissions in US trade: + 0-5% of national inventory • 2004: net embodied CO2 emissions in US trade: + 5-21% of national inventory
Key Findings: Global Warming(continued) • Greenhouse gas potential of recycling is large • “Counting recovery” in Oregon in 2005 reduced emissions by 3.3 million metric tonnes of CO2 equivalent • 4.6% of statewide emissions • Equivalent of removing 710,000 “average” passenger cars • Curbside vehicle emissions are relatively small • 100 tons of mixed curbside recyclables: ~4 MTCO2E from on-route collection emissions compared to -235 MTCO2E net (system) • Greenhouse gas potential of waste prevention is even larger
Year 2004 Forecast of Materials-Related Greenhouse Gas Emissions “Business as Usual”* 50% Recovery Goal Waste Prevention Goal *Per-capita waste generation continues to grow, recovery rate stays at 47%
Energy 11
EPA Energy and Waste Resources: Report: http://epa.gov/climatechange/ wycd/waste/ SWMGHGreport.html WARM and other tools: http://epa.gov/climatechange/ wycd/waste/tools.html 12
Key Findings: Energy • Again, fuel use by collection vehicles is relatively unimportant. • 100 tons of mixed curbside recyclables: ~54 MM BTU for on-route collection compared to ~1,440 MM BTU saved by industry using those recyclables • Long-haul also not very significant
Focus: Transport to Markets Question: When are Markets “Too Far” to Justify Long-Haul? Material Production Savings “Break-Even Point” (miles) (MMBTU ton collected) Truck Rail Freighter Aluminum 177 121,000 475,000 538,000 LDPE 61 41,000 162,000 184,000 PET 59 40,000 157,000 178,000 Steel 19 13,000 52,000 59,000 Newspaper 16 11,000 43,000 49,000 Corrugated 12 9,000 33,000 38,000 Office Paper 10 7,000 27,000 31,000 Boxboard 6.5 4,400 17,400 19,800 Glass (to bottles) 1.9 1,300 5,100 5,800 14
The Choice of End-Markets Matter (sometimes) Glass Bottles in Ontario, Oregon (Idaho border) Bottles to aggregate (local market) • Net savings per ton collected: ~0.2 MMBTU Excludes local processing, transport; assumes displaced virgin aggregate 30 miles distant Bottles to Portland (bottle plant) • Net savings per ton collected: ~2.1 MMBTU Bottles to California via Portland (fiberglass) • Net savings per ton collected: ~3.2 MMBTU
Key Findings: Energy(continued) • Energy savings potential of recycling is large • Recycling in Oregon in 2005 saved ~30 trillion BTUs of energy • ~2.6% of total statewide use • Equivalent of ~237 million gallons of gasoline • Again, benefits are primarily upstream, not downstream
Bags and Boxes • Boxes have recyclability and recycled-content advantages over most types of bags. • But bags have waste prevention advantages over boxes (for non-breakable items), due to lower weight. • Different types of bags and void fills for boxes exist – can we state with any certainty that one general approach is better than the other, from a cross-media perspective?
DEQ Life Cycle Inventory Analysis: Background • Commissioned by Oregon DEQ and co-funded by Metro (Portland) and the U.S. EPA Environmentally Preferable Purchasing Program. • Study is an inventory analysis (not an impact analysis) of 26 different packaging options for mail-order non-breakable items. • Consultant team: • Life Cycle Analysis: Franklin Associates (Kansas) • Packaging Engineering: Pack Edge Development (Oregon) • Critical Review Panel: Mary Ann Curran (EPA ORD), Dr. Joyce Cooper (U. of Washington) and Dr. Gregory A. Keoleian (U. of Michigan) • Study available at: www.deq.state.or.us/lq/sw/packaging/resources.htm
DEQ Packaging Study: Materials Evaluated *Different levels of post-consumer content also evaluated.
Results: Atmospheric Fossil Derived Carbon Dioxide* *Landfill, waste incineration, and forestry-related emissions not included. 28
Mass Matters! • Weight of materials used is a critical factor: • All bags evaluated have lower burdens than boxes (in most categories) because of their much lower weight. • This confirms (indirectly) the relative ranking of waste prevention and recycling in the waste management hierarchy. • Recyclability and recycled content are not always the best predictor of life cycle energy use or emissions: • The manufactured loose fill option with the highest post consumer content (molded pulp) also has the highest use of non-renewable fuels. • BUT, once you’ve chosen a packaging material, increasing post-consumer content and recycling opportunities can have benefits.
Caveats and Disclaimers • Please read the foreword and preface of the report. • Please don’t . . . • . . . interpret the study as being “anti-paper” • . . . interpret the study as being “anti-box” • . . . interpret the study as being “anti-recycling” or “anti-recycled content”
DEQ/Metro Packaging Waste Prevention Project: Other Results • Net savings: $994,000 and 493 tons of waste/year. • Estimated the energy savings from some packaging waste prevention actions. • Rejuvenation box reuse: ~1 billion BTU/year. • Norm Thompson use of shipping bags: ~21 billion BTU/year (~14 billion BTU/year from non-renewable fuels).
Closing Thoughts • The hierarchy generally makes good sense • Prevention (and reuse) before recycling • Recycling before composting • Recovery before landfilling • Benefits of focusing upstream, reducing focus on landfill avoidance • Life cycle analysis and a focus on energy and greenhouse gases provides waste programs with tools and a framework useful for: • Prioritizing efforts • Communicating with public and policy makers • Conducting critical analysis of options to achieve real environmental benefits • Life cycle inventory analysis and tools are becoming easier to use . . . thank you again, EPA!
Thank You After viewing the links to additional resources, please complete our online feedback form. Thank You Links to Additional Resources