Download
1 / 53
550 likes | 759 Views
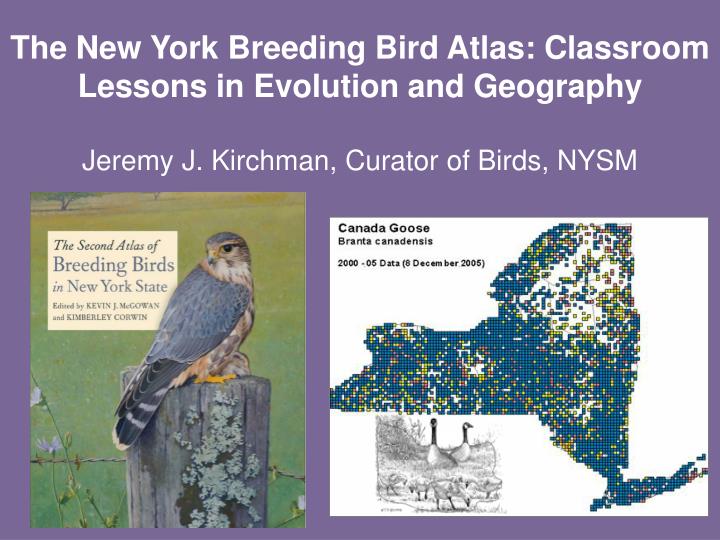
The New York Breeding Bird Atlas: Classroom Lessons in Evolution and Geography Jeremy J. Kirchman, Curator of Birds, NYSM. What is the Breeding Bird Atlas?. A multi-year “citizen science” project to survey of all the birds species that breed in NY.

E N D
The New York Breeding Bird Atlas: Classroom Lessons in Evolution and GeographyJeremy J. Kirchman, Curator of Birds, NYSM
What is the Breeding Bird Atlas? • A multi-year “citizen science” project to survey of all the birds species that breed in NY. • A re-survey, providing a snapshot of 20 years of change in bird distributions • A book, a website, an exhibit • An important tool for education, research, and conservation.
An interesting tidbit to get you thinking about range maps and evolution The Red-bellied Woodpecker USGS Breeding Bird Survey Map for 2003
An interesting tidbit to get you thinking about range maps and evolution The Red-bellied Woodpecker • NY BBA Map 1980-85 NY BBA Map 2000-05
And how does this affect a closely related species, the Red-headed Woodpecker? • NY BBA Map 1980-85 NY BBA Map 2000-05
Outline for today’s talk • Introduction to the Breeding Bird Atlas • Using the BBA in your classroom • Evolutionary concepts illustrated by the Atlas • Investigating distribution changes over last 20 years • A fun exercise to think about the causes of change • Tour of Mapping the Birds of New York
The Atlas of Breeding Birds in New York State. 1988. R. F. Anderle & J. R. Carrol, eds. Surveys conducted 1980-1985
Methodology • Ten regions, regional coordinators • 5332 blocks, 5km x 5km
Block 5486A Atlas Region 7: 690 blocks
Data Collection Surveyors visited all habitats in their block Spend >8 hours, at least one nocturnal survey Record evidence of breeding in all species: Possible: bird seen in likely habitat Probable: territory, courtship, nest building Confirmed: nest witheggs, incubation, feeding young, fledglings
New York State’s Second Breeding Bird Atlas • Field work 2000-05 using same methods as 1980-85 • 1,200 volunteers surveyed 5,333 5x5 km blocks • 519,562 observations of 253 species (+ 3 hybrids) • Compiled by regional coordinators and sent to project coordinator Kimberly Corwin at NYSDEC • Sponsored by The New York State Ornithological Association, NYSDEC (Give a Gift to Wildlife) and Cornell University Department of Natural Resources and Lab of Ornithology
The Second Atlas of Breeding Birds in New York State. 2008. K. J. McGowan & K. Corwin, Eds. Surveys conducted 2000-2005
What changed in New York since 1980? • Human population grew 7.5%, but also shifted (18/62 counties lost population) • Freshwater wetlands increased and tidal wetlands decreased • Agriculture and associated grasslands continued to decline • Forest cover stayed the same (62%), but matured
Changes in bird distributions 253 breeding species 70 (28%)increased 125 (49%) no change 58 (23%) decreased
Bald Eagle 1164% increase
Tufted Titmouse 99% increase
2000 – 2005 Data Carolina Wren 308% increase
Cooper’s Hawk 145% increase
Wild Turkey 132% increase
Palm Warbler New NY breeder in 1st atlas Now in 43 blocks (4300%)
6 “New” SpeciesTrumpeter Swan, Common Eider , Black Vulture, Merlin, Sandhill Crane, Wilson’s Phalarope Black Vulture found in 102 blocks!
6 “New” SpeciesTrumpeter Swan, Common Eider , Black Vulture, Merlin, Sandhill Crane, Wilson’s Phalarope Found in 129 blocks!
2000 – 2005 Data Henslow’s Sparrow 80% decrease
Red-headed Woodpecker 76% decrease
2 species were “lost”Confirmed in first Atlas, but not in secondCanvasback and Loggerhead Shrike
2 species were “lost”Confirmed in first Atlas, but not in second Canvasback and Loggerhead Shrike
Breeding Bird Atlas in the Classroom • Use the BBA website (www.dec.ny.gov/cfmx/extapps/bba), and other sites with facts about birds (www.dec.ny.gov/animals/271, www.birds.cornell.edu) • Compare maps for species with habitat or elevation requirements • Compare maps from 1985 and 2005 • Generate lists of species for individual blocks to investigate changes in your own backyard
Multiple choice habitat questions: Which of these species nests on cliffs and tall buildings? Which of these species requires large bodies of water? Which of these species nests only where humans live?
8 species lost since 1980-85 Ring-necked Pheasant Roughed Grouse Great Horned Owl Killdeer Whip-poor-will Common Nighthawk Chimney Swift Eastern Meadowlark 24 gained since 1980-85 Wild Turkey, American Woodcock, Broad-winged Hawk, Red-shouldered Hawk, Red-bellied Woodpecker, Black-billed Cuckoo, Yellow-billed Cuckoo, Great-crested Flycatcher, Eastern Wood Peewee, Alder Flycatcher, Willow Flycatcher, Red-breasted Nuthatch, Brown Creeper, Carolina Wren, Purple Martin, Blue-headed Vireo, Yellow-throated Vireo, Blue-winged Warbler, Nashville Warbler, American Redstart, Pine Warbler, Chestnut-sided Warbler, Ovenbird, White-throated Sparrow, Dark-eyed Junco Block 5872B
What can your students learn from studying the atlas? • Vocabulary: biogeography, topography, population, niche, breeding-range, distribution, data, trend, habitat specialist/generalist, extirpation, colonization, competition, land-use… • How to read and compare maps • Species evolve in a response to environmental changes • Evolution happens all the time, and can be seen on timescales as short as 20 years
One last example of the evolutionary importance of distributions:The case of the hybridizing warblers Blue-winged Warbler Golden-winged Warbler
53% Decline in 20 years Uses early successional habitats