Download

1 / 23
230 likes | 351 Views
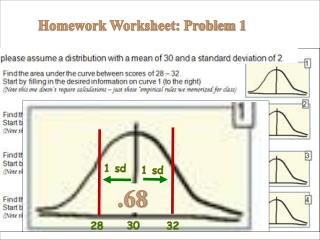
Homework Worksheet Review. Please click in. Set your clicker to channel 41. My last name starts with a letter somewhere between A. A – D B. E – L C. M – R D. S – Z.

E N D
Please click in Set your clicker to channel 41 My last name starts with a letter somewhere between A. A – D B. E – L C. M – R D. S – Z
Introduction to Statistics for the Social SciencesSBS200, COMM200, GEOG200, PA200, POL200, SOC200Lecture Section 001, Fall, 2011Room 201 Physics-Atmospheric Sciences (PAS)10:00 - 10:50 Mondays & Wednesdays + Lab Session Welcome http://www.youtube.com/watch?v=oSQJP40PcGI
Homework #10 (Due October 31st) Complete Homework Hypothesis testing with z and t-scores Available on class website Please double check – All cell phones other electronic devices are turned off and stowed away
Use this as your study guide By the end of lecture today10/24/11 Logic of hypothesis testing Steps for hypothesis testing One-tailed versus two-tailed test Levels of significance (Levels of alpha) what does alpha of .05 mean? what does p < 0.05 mean? what does alpha of .01 mean? what does p < 0.01 mean?
Please read: Chapters 10 – 12 in Lind book and Chapters 2 – 4 in Plous book: (Before the next exam) Lind Chapter 10: One sample Tests of Hypothesis Chapter 11: Two sample Tests of Hypothesis Chapter 12: Analysis of Variance Plous Chapter 2: Cognitive Dissonance Chapter 3: Memory and Hindsight Bias Chapter 4: Context Dependence
Five steps to hypothesis testing Step 1: Identify the research problem (hypothesis) Describe the null and alternative hypotheses Step 2: Decision rule • Alpha level? (α= .05 or .01)? • Critical statistic (e.g. critical z) value? Step 3: Calculations Step 4: Make decision whether or not to reject null hypothesis If observed z is bigger than critical z then reject null (It is a “significant difference” and p < 0.05) Step 5: Conclusion - tie findings back in to research problem
Measurements that occur within the middle part of the curve are ordinary (typical) and probably belong there For scores that fall into the middle range, we do not reject the null Moving from descriptive stats into inferential stats…. Critical z 1.96 Critical z -1.96 95% 2.5% 2.5% Measurements that occur outside this middle ranges are suspicious, may be an error or belong elsewhere For scores that fall into the regions of rejection, we reject the null What percent of the distribution will fall in region of rejection Critical Values http://today.msnbc.msn.com/id/33411196/ns/today-today_health/ http://www.youtube.com/watch?v=0r7NXEWpheg
Rejecting the null hypothesis • If the observed z falls beyond the critical z in the distribution (curve): • then it is so rare, we conclude it must be from some other distribution • then we reject the null hypothesis • then we have support for our alternative hypothesis • If the observed z falls within the critical z in the distribution (curve): • then we know it is a common score and is likely to be part of this distribution, • we conclude it must be from this distribution • then we do not reject the null hypothesis • then we do not have support for our alternative hypothesis
Rejecting the null hypothesis • The result is “statistically significant” if: • the observed statistic is larger than the critical statistic • observed stat > critical stat If we want to reject the null, we want our t (or z or r or F or x2) to be big!! • the p value is less than 0.05 (which is our alpha) • p < 0.05 If we want to reject the null, we want our “p” to be small!! • we reject the null hypothesis • then we have support for our alternative hypothesis A note on decision making following procedure versus being right relative to the “TRUTH”
. Decision making: Procedures versus outcome Best guess versus “truth” What does it mean to be correct? • Why do we say: • “innocent until proven guilty” • “not guilty” rather than “innocent” • Is it possible we got a verdict wrong?
Possible outcomes of hypothesis test Status of Null Hypothesis(actually, via magic truth-line) True Ho False Ho Do notReject Ho Decision madeby experimenter Reject Ho You are wrong! Type II error(miss) You are right! Correct decision You are wrong! Type I error(false alarm) You are right! Correct decision • Probability of rejecting a true null hypothesis = alpha • The alpha you choose becomes the probability of • making a Type I error
Measurements that occur within the middle part of the curve are ordinary (typical) and probably belong there 95th Percentile: 95% of the distribution falls below (or is equal to) that score 5th Percentile: 5% of the distribution falls below (or is equal to) that score Distribution of the weights of healthy babies Moving from descriptive stats into inferential stats…. 90% 5% 5% Measurements that occur outside this middle ranges are suspicious, may be an error or belong elsewhere What percent of the distribution will fall above that score? What percent of the distribution will fall below that score? http://today.msnbc.msn.com/id/33411196/ns/today-today_health/ http://www.youtube.com/watch?v=0r7NXEWpheg
One versus two tail test of significance:Comparing different critical scores(but same alpha level – e.g. alpha = 5%) One versus two tailed test of significance 95% 95% 2.5% 5% 2.5% How would the critical z change? Pros and cons…
One versus two tail test of significance5% versus 1% alpha levels How would the critical z change? 2.5% .5% 5% 2.5% 1% .5% -1.64 or +1.64 -1.96 or +1.96 -2.33 or +2.33 -2.58 or +2.58
One versus two tail test of significance5% versus 1% alpha levels What if our observed z = 2.0? How would the critical z change? -1.64 or +1.64 -1.96 or +1.96 Remember, reject the null if the observed z is bigger than the critical z Reject the null Reject the null -2.33 or +2.33 -2.58 or +2.58 Do notReject the null Do notReject the null
One versus two tail test of significance5% versus 1% alpha levels What if our observed z = 1.75? How would the critical z change? -1.64 or +1.64 -1.96 or +1.96 Do not Reject the null Remember, reject the null if the observed z is bigger than the critical z Reject the null -2.33 or +2.33 -2.58 or +2.58 Do notReject the null Do notReject the null
One versus two tail test of significance5% versus 1% alpha levels What if our observed z = 2.45? How would the critical z change? -1.64 or +1.64 -1.96 or +1.96 Remember, reject the null if the observed z is bigger than the critical z Reject the null Reject the null -2.33 or +2.33 -2.58 or +2.58 Do notReject the null Reject the null
. One or two tailed test? How many levels of the IV are there? This is two-tailed test Two levels What if we were looking to see if our new management program provides different results in employee happiness than the old program. What is the independent variable? a. The employees’ happiness b. Whether the new program works better c. The type of management program (new vs old) d. Comparing the null and alternative hypothesis Independent Variable
. What if we were looking to see if our new management program provides different results in employee happiness than the old program. What is the dependent variable? Dependent Variable a. The employees’ happiness b. Whether the new program works better c. The type of management program (new vs old) d. Comparing the null and alternative hypothesis
. . Remember the null says “no difference between groups” (between levels of IV) What if we were looking to see if our new management program provides different results in employee happiness than the old program. What would null hypothesis be? a. None of the employees are happy b. The program does not affect employee happiness c. The new programs works better d. The old program works better Null Hypothesis
. . Type I Error = False Alarm Which of the following is a Type I error: a. We conclude that the program works better when it fact it doesn’t b. We conclude that the program works better when in fact it does c. We conclude that the program doesn’t work better when in fact it doesn’t d. We conclude that the program doesn’t work better when in fact it does
Thank you! See you next time!!