Download
1 / 37
370 likes | 582 Views
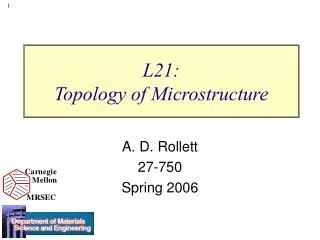
Histograms Analysis of the Microstructure of Halftone Images. J.S. Arney & Y . M . Wong Center for Imaging Science , RIT Given by Linh V. Tran ITN, Campus Norrköping, Linköping University In Digital Halftoning Course. Jan. 17, 2003. Outline.

E N D
Histograms Analysis of the Microstructure of Halftone Images J.S. Arney & Y.M. WongCenter for Imaging Science,RIT Given byLinh V. TranITN, Campus Norrköping, Linköping University In Digital Halftoning Course. Jan. 17, 2003
Outline • J.S. Arney & Y.M. Wong. ”Histograms Analysis of the Microstructure of Halftone Images”. 1999 • Problem definition • Ideal case • More Complicated cases in Reality • Solution: Modeling the bimodal histogram • Experiments • MatLab Halftoning Toolbox Developed in University of Texas at Austin, TX, USA • Comparison several halftoning methods Done by Michael Bruce deLeon, Stanford, USA
Problem • Estimate • The mean reflectance of the paper between the halftone dots, RP • The mean reflectance of the dots, RIand • The halftone dot area fraction, F of a given printed patch.
Paper Ink F 1-F 0 RiRp1 A perfect frequency occurrence of gray levels of reflectance consists of 2 delta functions. Ideal case • Perfect ink drops • No dot gain
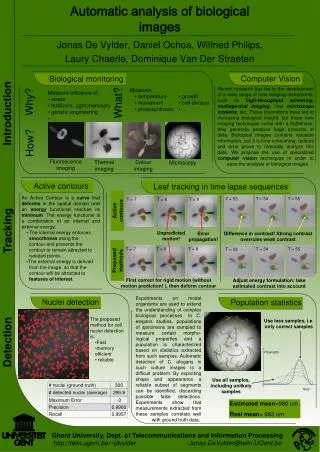
Microdensitometry CCDCamera • CCD Camera:1000x1000 pixels • Can measure also • Resolutions • Granularity • Micro-distribution of color in the image Microscope paper
Experiments • Histogram of 65 LPI AM halftone printed by offset lithography, measured at 5 mm field of view (FOV)
More Difficult • Histograms at 5mm FOV of error diffusion dot pattern printed by thermal ink jet at 300 dpi with F = 0.5
More and More Difficult • Histograms at 5mm FOV of error diffusion dot pattern printed by thermal ink jet at 300 dpi with F = 0.05
The edge modeled withRmin=0.3, Rmax=0. 7a=10, and b=0.5 Modelling the Bimodal Histogram
dx Frequency Occurence of R
Curve Fitting Five unknowns:Rmax Rmin a, b
Implementation • Main results published earlier in Wong’s B.Sc. Thesis: ”Modeling the Halftone Image to Determine the Area Fraction of Ink” CIS, RIT, 1998 • www.cis.rit.edu/research/thesis/bs/1998/wong • Simulations mainly done in MathCAD
Halftoning MatLab ToolboxDeveloped in University of Texas at Austin, TX, USA • Grayscale halftoning methods • Classical and user-defined screens • Classical error diffusion methods • Edge enhancement error diffusion • Green noise error diffusion • Block error diffusion • Figures of merit measures for grayscale halftones • Peak signal-to-noise ratio (PSNR) • Weighted signal-to-noise ratio (WSNR) • Linear distortion measure (LDM) • Universal quality index (UQI)
Figures of Merit • PSNR: Peak Signal to Noise Ratioof the output image with respect to the input image in dB
Figures of Merit • WSNR: Weighted Signal to Noise Ratio of output image with respect to the input image in dB.A weighting appropriate to the human visual systemis used.J. Mannos and D. Sakrison, "The effects of a visual fidelity criterion on the encoding of images", IEEE Trans. Inf. Theory, IT-20(4), pp. 525-535, July 1974 • LDM: Linear Distortion Ratio. • UQI: Universal image Quality Index.Zhou Wang and Alan C. Bovik "A Universal Image Quality Index" IEEE Signal Processing Letters, 2001
Halftoning MatLab Toolbox • Color halftoning methods • Classical and user-defined (multilevel) screens (separable) • Classical separable error diffusion methods (separable) • Edge enhancement error diffusion (separable) • Green noise error diffusion (separable) • Block error diffusion (separable) • Minimum brightness variation quadruple error diffusion (non-separable design for separable implementation) • Vector error diffusion (non-separable) • Figures of merit measures for color • PSNR, WSNR, LDM, UQI as in grayscale halftoning • Noise gain in dB over Floyd-Steinberg error diffusion (specific to Vector Error Diffusion)
Demo • http://www.ece.utexas.edu/~bevans/projects/halftoning/toolbox/
DeLeon’s Comparison • Done by Michael Bruce deLeon, Stanford, USAhttp://ise0.stanford.edu/~mdeleon/ • Methods: • Bayer Dither Matrix: 8x8 matrix • Three Level Dither • Error Diffusion: Floyd and Steinberg • MBVQ Error Diffusion(Minimum Brightness Variation Quadrants) • Test images: Ramps, Trees, Lena, Chart
Original Image • Bayer Dither Matrix • 3 Level Dither • Error Diffusion • MBVQ Error Diffusion
Original Image • Bayer Dither Matrix • 3 Level Dither • Error Diffusion • MBVQ Error Diffusion
DeLeon’s Conclusions • Solid tones seem the most difficult to present smoothly witha halftoning pattern.Thus, simple computer graphics maybe more of a challenge for a printer than complex photos. • The color error diffusion algorithm can effectively limit the number of colors used for a given region. Its execution time is only marginally longer than that of regular errordiffusion.The pattern produced is slightly smoother than the regular error diffusion results, though unless closely examined in these monitor examples, the differences in dot brightness & color is easy to miss. Depending in its use with actual inks, tradeoffs might have to be made between the appearancesof colors in grayscale images and this smoothing effect.
DeLeon’s Conclusions • Multi-level halftoning seems to offer considerable image quality improvement without expensive algorithms. Although the expenses for realizing this functionality come from other areas (cost of extra inks, complexity of multi-drop or variable drop print head), the results would probably justify the extra overhead. • Model-based halftoning seems like an interesting way to make use of our understanding of the human visual system, but the complexity of these algorithms seems to limit their usefulness for the time being.