Download
1 / 40
400 likes | 552 Views
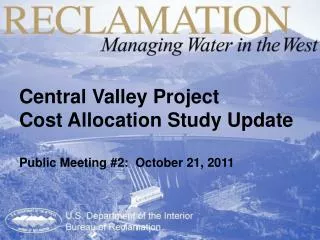
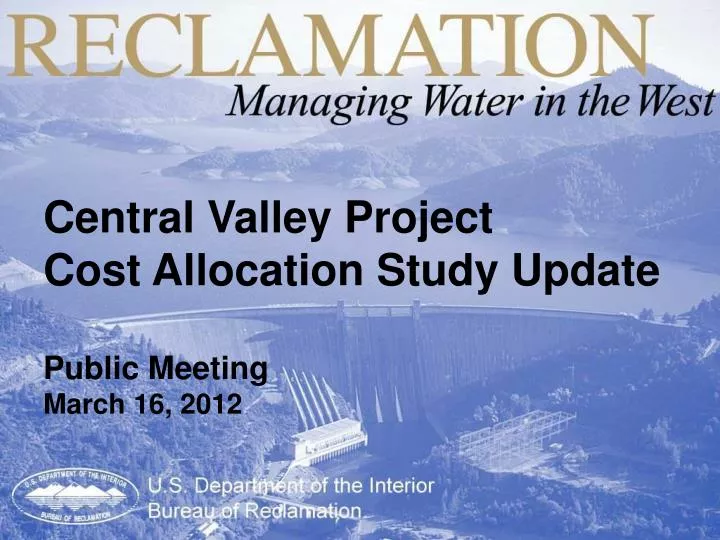
Cost Allocation Studies for the MP Region. Central Valley Project Cost Allocation Study Update Public Meeting March 16, 2012. Bureau of Reclamation April 29, 2008. Central Valley Project Cost Allocation Study. CVP-CAS. Meeting Purpose Continued Flood Control Discussions

E N D
Cost Allocation Studies for the MP Region Central Valley Project Cost Allocation Study Update Public Meeting March 16, 2012 Bureau of Reclamation April 29, 2008
Central Valley Project Cost Allocation Study CVP-CAS Meeting Purpose • Continued Flood Control Discussions • Hydrology Modeling Assumptions • Cost Estimating Methodology
Central Valley Project Cost Allocation Study CVP-CAS Background • Last Meeting on 10/21/11 • Introduced Flood Control Purpose for Shasta • Hydrology Modeling Initial Assumptions • Estimating Single Purpose Alternative Costs • Flood Control Benefits (Corps)
Central Valley Project Cost Allocation Study CVP-CAS Summary of Feedback Received • Public Involvement -More Frequent and Timely Meetings • CVP Facilities - Inclusions and Exclusions • Methodology • Support Efficiencies in Process • Hydrology Modeling - Assumption Questions • Estimating Costs - Concerns with Indexing vs. Re-pricing
Central Valley Project Cost Allocation Study CVP-CAS Hydrology Analysis for Single Purpose Flood Control Operations Nancy Parker BOR Technical Services Center
Hydrology Analysis for Single Purpose Flood Control Reservoir Sizing CVP-CAS - Hydrology Analysis • How much of the reservoir is used for flood control? • How big would a reservoir need to be to solely provide flood control? • This is not a probable maximum flood analysis • Analysis Methods • Flood Control Rule Curve • Daily Hydrology Model • Comparison to Historical Operations • Unique considerations for each facility
Flood Control Rule Method CVP-CAS - Hydrology Analysis
Flood Control Rule Method CVP-CAS - Hydrology Analysis
Daily Hydrology Method CVP-CAS - Hydrology Analysis • Inputs - Minimum storage, inflow, evaporation rate, discharge rating curve, bathymetry, release criteria • Hydrology • Historical calculated daily inflow provided by CVO • Historical daily flows at downstream control locations • Acquired from CDEC • Used to calculate downstream accretions • Assumptions/Limitations • Accretions are not unimpaired • No reservoir routing • Monthly evaporation rates • Minimum Storage and Discharge Capacity • Assume levels used in current operations
Daily Hydrology Method CVP-CAS - Hydrology Analysis
Shasta Flood Control Facility CVP-CAS - Hydrology Analysis • Daily Model Assumptions/Controls • 79,000 cubic feet per second (cfs) maximum flow at Keswick • 100,000 cfs maximum flow at Bend Bridge • Historical accretions = Bend Bridge – Keswick • Minimum storage of 550 thousand acre feet (taf) • Operational Responsibilities • Flow standards at Red Bluff Diversion Dam • Flow standards at Wilkins Slough • Flow standards at Rio Vista • Delta Water Quality • Delta Outflow • Deliveries to Sacramento River CVP water users • CVP Delta Exports
Shasta Rule Curve Method CVP-CAS - Hydrology Analysis • Examine monthly time series of Flood Control (FC) Rules • Max Capacity – Min FC Rule + Min Storage = Required Space
CVP-CAS - Hydrology Analysis Historical releases anticipate inflow event. Enabled by higher capacity for release at higher storage level.
Shasta Summary(All Values in TAF) CVP-CAS - Hydrology Analysis
Folsom Flood Control Facility CVP-CAS - Hydrology Analysis • Daily Model Assumptions/Controls • 115,000 cfs maximum release from Nimbus • Minimum storage of 90 taf • Operational Responsibilities • Flow standard below Nimbus • Flow standard at American River at H Street • Delta water quality • Delta outflow • Deliveries to American River contractors • CVP Delta Exports
Folsom Summary (All Values in TAF) CVP-CAS - Hydrology Analysis
New Melones Flood Control Facility CVP-CAS - Hydrology Analysis • Daily Model Assumptions • 8000 cfs maximum flow at Ripon • Historical accretions = Ripon – Goodwin • Minimum storage of 80 taf • Operational Responsibilities • Flow standard at Goodwin • Flow standard at Ripon • Dissolved Oxygen standard at Ripon • Water Quality standard at Vernalis • Flow standard at Vernalis • Deliveries to CVP Stanislaus River CVP contractors
New Melones Summary(All Values in TAF) CVP-CAS - Hydrology Analysis
Friant Flood Control Facility CVP-CAS - Hydrology Analysis • Daily Model Assumptions • Maximum release 8000 cfs • Maximum release 9000 cfs • Maximum storage 524 taf • Operational Responsibilities • San Joaquin River Restoration Flow Releases • Release for upper San Joaquin River water rights • Delivery to Friant Kern and Madera Canals • Unique Analysis Challenges • Direct delivery from reservoir to canals • Evolving consideration of flood flows in San Joaquin • Restoration reoperations modifying flood rules
Friant Summary (All Values in TAF) CVP-CAS - Hydrology Analysis
CVP-CAS – Cost Estimating Estimating Costs for Single Purpose Flood Control at Shasta Alan Stroppini Reclamation Design and Construction Division
CVP-CAS – Cost Estimating Cost Estimating Goals • Easy to Apply • Easy to Understand • Scalable • Comparable to Other Cost Estimates • Comparable to Benefits Analysis
CVP-CAS – Cost Estimating Cost Estimating Methods • Cost Indexing • Reclamation Indexes • Engineering News Record (ENR) Indexes • Building Cost Indexes (BCI) • Construction Cost Indexes (CCI) • Re-pricing Model
CVP-CAS – Cost Estimating Cost Indexing – Reclamation Methods • Indexes Available 1940 to present • Published Quarterly by Reclamation • Developed to represent cost escalation associated with typical Reclamation facilities
CVP-CAS – Cost Estimating Cost Indexing – ENR CCI Method • Indexes Available 1908 to present • Published Quarterly by ENR • Developed based on the following • 200 hours of common labor at the 20-city average of common labor rates • 25 cwt of standard structural steel shapes at the mill price prior to 1996 and the fabricated 20-city price from 1996 • 1.128 tons of portland cement at the 20-city price • 1,088 board-ft of 2 x 4 lumber at the 20-city price
CVP-CAS – Cost Estimating Cost Indexing – ENR BCI Method • Indexes Available 1915 to present • Published Quarterly by ENR • Developed based on the following • 68.38 hours of skilled labor at the 20-city average of bricklayers, carpenters and structural ironworkers rates • 25 cwt of standard structural steel shapes at the mill price prior to 1996 and the fabricated 20-city price from 1996 • 1.128 tons of portland cement at the 20-city price • 1,088 board-ft of 2 x 4 lumber at the 20-city price
CVP-CAS – Cost Estimating Cost Index Comparison for Concrete Dams
CVP-CAS – Cost Estimating Shasta Multi-Purpose FacilityIndexing Results – 4.5 MAF
CVP-CAS – Cost Estimating Re-pricing Model • Based on Bid Abstract Analysis • Define Major Bid Items in Abstract • Develop Unit Prices for Identified Major Items • Consider Other Cost Items, including • Mobilization • Design & Construction Contingencies • Other Non-Contract Costs • Develop Project Cost Model Comparable to Plant-in-Service Cost Representation
CVP-CAS – Cost Estimating Shasta Dam and Powerplant Abstract Analysis
CVP-CAS – Cost Estimating Develop Unit Prices for Major Bid Items Add-On Percentages
CVP-CAS – Cost Estimating Shasta Dam & Powerplant: Contract/Field Costs Re-Priced Bid Item Quantity Cost Final Cost _________________________________________________________________________________________________________________________ Concrete 6,300,000 $ 200 $ 1,260,000,000 Excavation 4,000,000 $ 24 $ 96,000,000 Rebar 31,000,000 $ 2 $ 62,000,000 Rockfill/Emb 1,800,000 $ 10 $ 18,000,000 _________________________________________________________________________________________________________________________ Mobilization (5%) $ 72,000,000 Design Contingency (15% +/-) $ 122,000,000 _________________________________________________________________________________________________________________________ Contract Cost $ 1,730,000,000 Construction Contingency (5% +/-) $ 90,000,000 _________________________________________________________________________________________________________________________ Field Cost $ 1,820,000,000
CVP-CAS – Cost Estimating Project Cost Estimating Model
CVP-CAS – Cost Estimating Shasta Dam and Reservoir Cost Curve Development
CVP-CAS – Cost Estimating Multi-Purpose Shasta Size: 4.5 MAF Re-priced Cost: $5.0 Billion +/- Shasta Flood Control Size: 2.0 MAF Re-priced Cost: $3.0 Billion +/-
Analysis Summary CVP-CAS
Next Steps CVP-CAS • Review and Respond to Comments Received • Refinement of Process and Schedule • Upcoming Public Meetings • June 29, 2012 • September 21, 2012 • December 14, 2012
Next Steps: Process & Schedule CVP-CAS 2010-2011 2012-2013 • Flood Control • Navigation • Recreation • Power • Water Supply • Water Supply (cont.) • Water Quality • Fish & Wildlife 2014-2015 • Draft Allocation • Prepare Report 2016 Ongoing Public Involvement • Methodology • Assumptions • Work Plan
www.usbr.gov/mp/cvp/cvp-cas/index.html CVP-CAS Traci Michel, Project Manager tmichel@usbr.gov