Download
1 / 38
410 likes | 668 Views
Applications of Homology Modeling. Hanka Venselaar. This seminar…. Homology Modeling… Why? What? When? How? And a few real world examples…. No structure:. ?. DFNB 63 Sequence:.

E N D
Applications of Homology Modeling Hanka Venselaar
This seminar…. Homology Modeling… • Why? • What? • When? • How? • And a few real world examples….
No structure: ? DFNB 63 Sequence: MGTPWRKRKGIAGPGLPDLSCALVLQPRAQVGTMSPAIALAFLPLVVTLLVRYRHYFRLLVRTVLLRSLRDCLSGLRIEERAFSYVLTHALPGDPGHILTTLDHWSSRCEYLSHMGPVKGQILMRLVEEKAPACVLELGTYCGYSTLLIARALPPGGRLLTVERDPRTAAVAEKLIRLAGFDEHMVELIVGSSEDVIPCLRTQYQLSRADLVLLAHRPRCYLRDLQLLEAHALLPAGATVLADHVLFPGAPRFLQYAKSCGRYRCRLHHTGLPDFPAIKDGIAQLTYAGPG Hearing loss
Why homology modeling? KKIALSDARSMKHALREIKIIRRLDHDNIVKVYEVLGPKGTDLQGELFKFSVAYIVQEYMETDLARLLEQGTLAEEHAKLFMYQLLRGLKYIHSANVLHRDLPANIFISTEDLVLKIGDFGLARIVDQHYSHKGYLSEGLVTKWYRSPRLLLSPNNYTKAIDMWAAGCILAEMLTGRMLFAGAHELEQMQLLETIPVIREEDKDELLRVMPSFVSS ? Translation Lab Bioinformatics ATOM 1 N GLN A 117 -42.882 10.838 12.153 1.00 58.09 N ATOM 2 CA GLN A 117 -42.770 10.783 10.668 1.00 58.36 C ATOM 3 C GLN A 117 -41.435 11.371 10.185 1.00 57.07 C ATOM 4 O GLN A 117 -41.264 12.582 10.210 1.00 57.81 O ATOM 5 CB GLN A 117 -43.966 11.532 10.028 1.00 59.40 C ATOM 6 CG GLN A 117 -45.344 10.768 10.084 1.00 62.58 C ATOM 7 CD GLN A 117 -45.254 9.261 9.651 1.00 67.37 C ATOM 8 OE1 GLN A 117 -44.260 8.554 9.948 1.00 68.20 O ATOM 9 NE2 GLN A 117 -46.304 8.778 8.955 1.00 67.47 N ATOM 10 N SER A 118 -40.488 10.545 9.741 1.00 54.71 N ATOM 11 CA SER A 118 -39.144 11.089 9.506 1.00 52.44 C ATOM 12 C SER A 118 -38.389 10.616 8.251 1.00 50.58 C ATOM 13 O SER A 118 -38.692 9.566 7.734 1.00 50.83 O ATOM 14 CB SER A 118 -38.317 10.815 10.736 1.00 52.75 C ATOM 15 OG SER A 118 -38.273 9.437 10.917 1.00 53.04 O ATOM 16 N CYS A 119 -37.428 11.398 7.755 1.00 48.00 N ATOM 17 CA CYS A 119 -36.748 11.070 6.507 1.00 46.41 C ATOM 18 C CYS A 119 -35.339 10.829 6.835 1.00 45.44 C ATOM 19 O CYS A 119 -34.845 11.360 7.805 1.00 45.36 O ATOM 20 CB CYS A 119 -36.721 12.232 5.504 1.00 45.97 C ATOM 21 SG CYS A 119 -38.275 12.940 5.114 1.00 47.29 S ATOM 22 N LEU A 120 -34.657 10.098 5.972 1.00 44.91 N
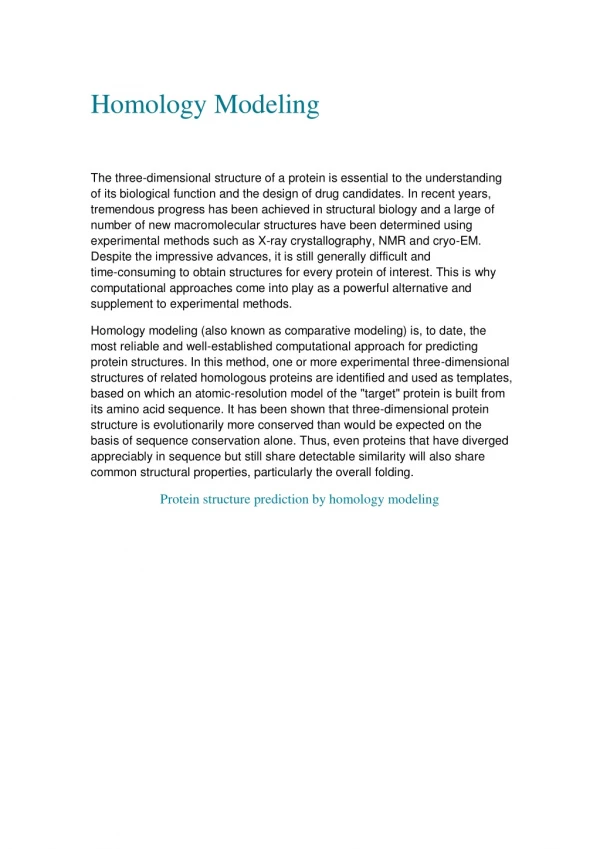
Protein structures – 4 levels L M Q H E A D L I Primary Secondary Tertiary Quaternary Shape of the protein determines its function…..
Protein structures…where can we find them? Protein DataBank = www.pdb.org
PDB-file: contains the coördinaties for every atom in a protein Visualisation with PDB-viewers -Jmol -PyMol -SwissPDB viewer -YASARA
So, 3D Protein-structures provide useful information But…… Not enough protein structures in the PDB database
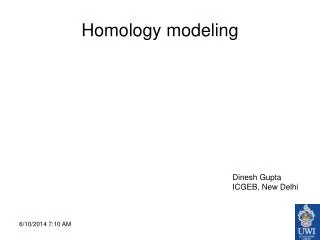
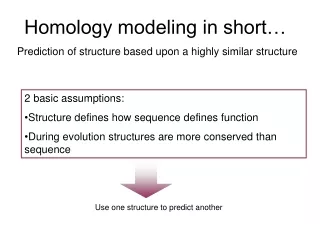
Homology modeling in short… Prediction of structure based upon a highly similar structure • 2 basic assumptions: • Structure defines function • During evolution structures are more conserved than sequence Use one structure to predict another
Homology modeling – When? O Example: by 80 residues 30% identity sufficient
NSDSECPLSHDG ? NSDSECPLSHDG || || | || NSYPGCPSSYDG Model sequence Unknown structure Known structure Back bone copied Homology modeling in short… Prediction of structure based upon a highly similar structure Model! Copy backbone and conserved residues Add sidechains, Molecular Dynamics simulation on model Known structure
1: Template recognition and initial alignment • BLAST your sequence against PDB • Best hit is usually your template • Initial alignment
2: Alignment correction 1: Template recognition and initial alignment
CPISRTAAS-FRCW CPISRTG-SMFRCW CPISRTA--TFRCW CPISRTAASHFRCW CPISRTGASIFRCW CPISRTA---FRCW CPISRTGASIFRCW CPISRTGASIFRCW CPISRTA---FRCW CPISRT---AFRCW Correct alignment 2: Alignment correction • Functional residues conserved • Use multiple sequence alignments • Deletions shift gaps Multipe sequence alignment Sequence with known structure Your sequence Both are possible
E I E E V V A P C C C S R R M R G L M P P 2: Alignment correction -A-V F-D- • Core residues conserved • Use multiple sequence alignments • Deletions in your sequence shift gaps Known structure FDICRLPGSAEAV Model FNVCRMP---EAI Model FNVCR---MPEAI Correct alignment
3: Backbone generation 2: Alignment correction 1: Template recognition and initial alignment
3: Backbone generation • Making the model…. • Copy backbone of template to model • Make deletions as discussed • (Keep conserved residues)
4: Loop modeling 2: Alignment correction 1: Template recognition and initial alignment 3: Backbone generation
4: Loop modeling Known structure GVCMYIEA---LDKYACNC Your sequence GECFMVKDLSNPSRYLCKC Loop library, try different options
5: Sidechain modeling 2: Alignment correction 1: Template recognition and initial alignment 3: Backbone generation 4: Loop modeling
5: Side-chain modeling • Several options • Libraries of preferred rotamers based upon backbone conformation
6: Model optimization 2: Alignment correction 1: Template recognition and initial alignment 3: Backbone generation 4: Loop modeling 5: Sidechain modeling
6: Model optimization • Molecular dynamics simulation • Remove big errors • Structure moves to lowest energy conformation
2: Alignment correction 1: Template recognition and initial alignment 3: Backbone generation 4: Loop modeling 5: Sidechain modeling 7: Model validation 6: Model optimization
7: Model Validation • Second opinion by PDBreport /WHATIF • Errors in active site? new alignment/ template • No errors? Model!
2: Alignment correction 1: Template recognition and initial alignment 3: Backbone generation 4: Loop modeling 8: Iteration 8: Iteration 5: Sidechain modeling 8: Iteration 8: Iteration 7: Model validation 6: Model optimization
2: Alignment correction 1: Template recognition and initial alignment 3: Backbone generation 4: Loop modeling 8: Iteration 8: Iteration 5: Sidechain modeling Model! 8: Iteration 8: Iteration 7: Model validation 6: Model optimization
Alignment Modeling Correction 8 steps of homology modeling 1: Template recognition and initial alignment 2: Alignment correction 3: Backbone generation 4: Loop modeling 5: Side-chain modeling 6: Model optimization 7: Model validation 8: Iteration
Structure! DFNB 63 Sequence: MGTPWRKRKGIAGPGLPDLSCALVLQPRAQVGTMSPAIALAFLPLVVTLLVRYRHYFRLLVRTVLLRSLRDCLSGLRIEERAFSYVLTHALPGDPGHILTTLDHWSSRCEYLSHMGPVKGQILMRLVEEKAPACVLELGTYCGYSTLLIARALPPGGRLLTVERDPRTAAVAEKLIRLAGFDEHMVELIVGSSEDVIPCLRTQYQLSRADLVLLAHRPRCYLRDLQLLEAHALLPAGATVLADHVLFPGAPRFLQYAKSCGRYRCRLHHTGLPDFPAIKDGIAQLTYAGPG Hearing loss
Mutation: • Tryptophan 105 -> Arginine Hydrophobic contacts from the Tryoptohan are lost, introduction of an hydrophilic and charged residue
The three mutated residues are all important for the correct positioning of Tyrosine 111 Tyrosine 111 is important for substrate binding Published in Nature Genetics: 2008 Oct 26.
Voorbeeld: C-terminale deletie van 10 aa in Dectine Afdeling: Interne geneeskunde of Internal Medicine >Dectin_1_Isoform_a MEYHPDLENLDEDGYTQLHFDSQSNTRIAVVSEKGSCAASPPWRLIAVILGILCLVILVIAVVLGTMAIWRSNSGSNTLENGYFLSRNKENHSQPTQSSLEDSVTPTKAVKTTGVLSSPCPPNWIIYEKSCYLFSMSLNSWDGSKRQCWQLGSNLLKIDSSNELGFIVKQVSSQPDNSFWIGLSRPQTEVPWLWEDGSTFSSNLFQIRTTATQENPSPNCVWIHVSVIYDQLCSVPSYSICEKKFSM
EEC syndrome Structure! P63 sequence MSQSTQTNEFLSPEVFQHIWDFLEQPICSVQPIDLNFVDEPSEDGATNKIEISMDCIRMQDSDLSDMWPQYTNLGLLNSMDQQIQNGSSSTSPYNTDHAQNSVTAPSPYAQPSSTFDALSPSPAIPSNTDYPGPHSFDVSFQQSSTAKSATWTYSTELKKLYCQIAKTCPIQIKVMTPPPQGAVIRAMPVYKKAEHVTEVVKRCPNHELSREFNEGQIAPPSHLIRVEGNSHAQYVEDPITGRQSVLVPYEPPQVGTEFTTVLYNFMCNSSCVGGMNRRPILIIVTLETRDGQVLGRRCFEARICACPGRDRKADEDSIRKQQVSDSTKNGDGTKRPFRQNTHGIQMTSIKKRRSPDDELLYLPVRGRETYEMLLKIKESLELMQYLPQHTIETYRQQQQQQHQHLLQKQTSIQSPSSYGNSSPPLNKMNSMNKLPSVSQLINPQQRNALTPTTIPDGMGANIPMMGTHMPMAGDMNGLSPTQALPPPLSMPSTSHCTPPPPYPTDCSIVSFLARLGCSSCLDYFTTQGLTTIYQIEHYSMDDLASLKIPEQFRHAIWKGILDHRQLHEFSSPSHLLRTPSSASTVSVGSSETRGERVIDAVRFTLRQTISFPPRDEWNDFNFDMDARRNKQQRIKEEGE EEC syndrome
Arginine • Loss of negative charge • Loss of interaction with the DNA Mutation RS Serine
To conclude…. Homology Modeling… • What? Prediction of an unknown structure based on an homologous and known structure • Why? To answer biological and medical questions when the “real” structure is unknown • When? A template with enough identity must be available • How? 8 Steps • Use the models for mutant analysis, experimental design and understanding of the protein in general