Download
1 / 48
730 likes | 1.92k Views
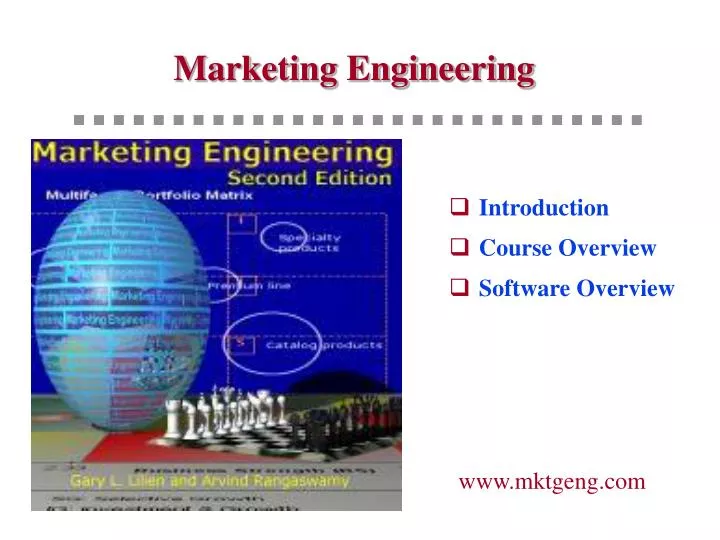
Marketing Engineering. Introduction Course Overview Software Overview. www.mktgeng.com. Daily Marketing Decisions. Budgets. Segmentation. Marketing Mix. Campaign effectiveness. Targeting. Market size. Sales channels. Market share. Positioning. Pricing policy. Portfolio Management.

E N D
Marketing Engineering • Introduction • Course Overview • Software Overview www.mktgeng.com
Daily Marketing Decisions Budgets Segmentation Marketing Mix Campaign effectiveness Targeting Market size Sales channels Market share Positioning Pricing policy Portfolio Management Advertising design
Trends in Software SupportedDecision Making • Marketing managers have high-powered personal computers connected to networks, 7/24, everywhere. • Volume of marketing data exploding. • Firms reengineering marketing for the information age (e.g., Using Customer Relationship Management systems). • Faster FasterFaster !!!!
21st Century Marketing Decisions • We have too much data of the wrong kind, not enough of the right kind (information has no value by itself, but generates value through its use). • Humans are imprecise information processors (in both analyzing and synthesizing information). • Computers/mathematical models are consistent information processors. • Managers (Possibility of)+ Models Better Decisions
Marketing Engineering: Marketing Analytics for the Manager Marketing Engineering involves developing and using interactive, customizable, computer-decision models for analyzing, planning, and implementing marketing tactics and strategies……or Concepts, frameworks and tools to the rescue!
Zone of Exceptional Zone of Death Marketing The Bell Curve for Wish Marketing Marketing Performance (Below (Above Average) (Average Average) (Well marketing (Well Below Above program) Average) Average) Marketing Performance Critical Troubling Average Pleasing Amazing Marketing Share Growth Dramatic Precipitous Significant Modest Increase Increase Decline Decline Decline New Product Success Rate 40%+ 0% 5% 10% 25% Advertising ROI 20% Negative 0% 1 - 4% 5 - 10% Promotional Programs Very Profitable Disaster Un - profitable Marginally Unprofitable Profitable Customer Satisfaction 90 - 95% 0 - 59% 60 - 69% 70 - 79% 80 - 89% Customer Retention/Loyalty 90 - 94% 0 - 44% 45 - 59% 60 - 74% 75 - 89% The objective is very simple. To improve marketing performance. The Opportunity for Marketing Analytics
The Market for Marketing Analytics • According to an International Data Corporation (IDC) report, “Information Access Tools: 1999 Worldwide Markets and Trends”: • There is a growing need for self-service access to information-rich decision processes that optimize business operations and relationships. Most marketing data are just sitting there, waiting to be analyzed and used. • The market for enterprise decision support tools should grow at the rate of 36% per year, from $2.4 billion in 1998 to $11.3 billion in 2003. • Aberdeen Group predicts that companies will spend $1.3 billion on analytical CRM in 2002, a $175 million increase over 2001.
The Market for Marketing Analytics • The Global 1,000 companies spend about $1 trillion on Marketing (Source: Accenture study 2001). • 68% of the participants indicate they have problems even articulating, much less measuring, the ROI of marketing (Source: Accenture study 2001). • Systematic marketing decision making can improve marketing productivity by 5 – 10% with minimal additional costs (i.e., it has very high ROI). (Source: Several studies documented in our Marketing Engineering book).
http: Request for a Model Web Server (Model Access Point) Browser Client (Model User) Java: A network-centric computer programming language. RMI: Remote Method Invocation A system that allows a Java object running on one machine to communicate with methods (e.g., models) of another Java object running on a different Java machine. http: Hypertext Transfer Protocol The protocol that defines communication between Web Servers and Clients. http: Response A Java Applet (user interface) Java RMI Java RMI Data Server (Data Store) Application Server (Model Store) Java RMI The Architecture of www.valueharvest.com
Key Concepts Behind Marketing Engineering ME Video Nov 2002 – 11
Marketing Engineering Marketing Environment Automatic scanning, data entry, subjective interpretation Marketing Engineering Data Database management, e.g.., selection, sorting, summarization, report generation Information Decision model; mental model Insights Judgment under uncertainty, e.g.., modeling, communication, introspection Decisions Financial, human, and other organizational resources Implementation
Models are the core of ME: Analytics….What is a Model? • A model is a stylized representation of reality that is easier to deal with and explore for a specific purpose than reality itself. • There are many types of models: • Verbal • Box and Arrow • Graphical • Mathematical • Spreadsheets
Verbal Model Sales of a new product often start slowly as “innovators” in the population adopt the product. The innovators influence “imitators,” leading to accelerated sales growth. As more people in the population purchase the product, sales continue to increase but sales growth slows down.
Pattern of Sales Growth of New Product Box and Arrow Model Fixed Population Size Imitators Innovators Innovators Influence Imitators Timing of Purchases by Imitators Timing of Purchases by Innovators
Graphical Model Cumulative Sales of a Product Fixed Population Size Time
dxt = (a + bxt)(N – xt) dt Mathematical Model xt = Total number of people who have adopted product by time t N = Population size a,b = Constants to be determined. The actual path of the curve will depend on these constants
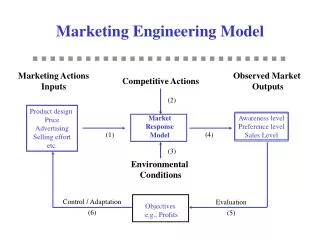
Awareness level Preference level Sales Level Product design Price Advertising Selling effort etc. Response Model System Marketing Actions Inputs Competitive Actions Observed Market Outputs (2) Market Response Model (1) (4) (3) Environmental Conditions Control Adaption (6) Evaluation (5) Objectives
Response Function Max Sales Response Response Function Current Sales Min Current Effort Effort Level
Objectives • Profit(= Sales ´ Margin – Costs) • Sales • Market share • Time horizon • Uncertainty • Multiple goals • Multiple points of view • ? ? ?
Are Models Valuable? Belief: ‘No mechanical prediction method can possibly capture the complicated cues and patterns humans use for prediction.’ Hard Fact: A host of studies in medical diagnosis, loan granting, auditing and production scheduling have shown that even simple models out-perform expert judgement. Example: Bowman and Kunreuther showed that simple models based on managers’ past behavior, (in terms of production scheduling and inventory decisions) out-perform the managers themselves in the future.
Are ‘Models’ the Whole Answer? No! The widespread availability of statistical packages has put mathematical bazookas in the hands of those who would be dangerous with an abacus. —Barnett To evaluate any decision aid, you need a proper baseline. 1. Intuitive judgement does not have an impressive track record. 2. When driving at night with your headlights on you do not necessarily see too well. But turning them off will not improve the situation. 3. ‘Decision aids do not guarantee perfect decisions but when appropriately used they will yield better decisions on average than intuition.’ —Hogarth, p.199
Models vs Intuition/Judgments Types of Subjective Objective Judgments Experts Mental Decision Decision Had to Make Model Model Model Academic performance of graduate students 0.19 0.25 0.54 Life expectancy of cancer patients –0.01 0.13 0.35 Changes in stock prices 0.23 0.29 0.80 Mental illness using personality tests 0.28 0.31 0.46 Grades and attitudes in psychology course 0.48 0.56 0.62 Business failures using financial ratios 0.50 0.53 0.67 Students’ rating of teaching effectiveness 0.35 0.56 0.91 Performance of life insurance salesman 0.13 0.14 0.43 IQ scores using Rorschach tests 0.47 0.51 0.54 Mean (across many studies)0.33 0.39 0.64
Applicant Profile(Academic performance of graduate students) Under- Appli- Personal Selectivity graduate College Work GMAT GMAT cant Essay of Under- Major Grade Exper- Verbal Quanti- graduate Institution Avg. ience tative 1 poor highest science 2.50 10 98% 60% 2 excellent above avg. business 3.82 0 70% 80% 3 average below avg. other 2.96 15 90% 80% • • • • • • • • • • • • • • • • 117 weak least business 3.10 100 98% 99% 118 strong above avg other 3.44 60 68% 67% 119 excellent highest science 2.16 5 85% 25% 120 strong not very business 3.98 12 30% 58%
Small Models Example:Trial/Repeat Model Share = % Aware ´ % Available | Aware ´ % Try | Aware, Available ´ % Repeat | Try, Aware, Available ´ Usage Rate
50% 80% 40% 50% Trial/Repeat Model Target Population Aware? Available? Try? Repeat? Market Share = ?
Trial hi low J hi Repeat low Model Diagnostics L
Trial Dynamics You never get everyone to try 100% % Population Trying (Trial) Time
´ Repeat Dynamics 100% Note—late triers often do not become regular users % Repeaters Among Triers (Repeat) Time
= Share Dynamics! Fiona ‘the brand manager’ gets promoted 100% Steve, her replacement, gets fired Share = (Trial ´ Repeat) John, ‘the caretaker’, takes over Time
What People Observed Sales/Outlet What People Thought # Company Outlets in Market New Phenomenon:Retail Outlet Management
Why? 100 80 Market Share= Outlet Share 60 Market Share 40 20 20 40 60 80 100 Outlet Share Typical outlet-share/market-share relationship
Retail Building Implications 1. Market Share = Outlet Share ú Use incremental analysis and spread resources evenly. But 2. Market Share/Outlet Share is S-shaped ú • Concentrate in few areas • Invest or divest
Model Benefits • Small models can offer insight – they can change your goals and priorities, even if they don’t influence your decisions. • Even simple models can align management beliefs with marketing policy. • You don’t need hard data to get value from models--judgments and intuition is often enough. • Digital data capture enables large model ROI.
Some Examples ofMarketing Engineering Value • Promotional Modeling (H J Heinz) • CALLPLAN (United Airlines) • ASSESSOR (Various Companies) • New Marketing Strategy/Cost of Visit (AT&T) • Hotel design at Marriott (Courtyard by Marriott) • Salesforce Sizing (Syntex) • Better Marketing Strategy (ABB Electric) • Revenue Management (American Airlines)
Marketing Engineering Organization and Objectives ME Video Nov 2002 – 37
Some Course Objectives: Learn…. • ..the value of systematic marketing decision making. • ..the language and tools of marketing consultants. • ..how successful companies benefit from marketing engineering. • ..how to critically evaluate analytical results. • ..become an analytical marketing consultant (i.e., to structure marketing problems and issues analytically using decision models).
We Focus on End-User Models End-User Models High-End Models Scale of problem Small/Medium Small/Large Time Availability Short Long (for setting up model) Costs/Benefits Low/Medium High User Training Moderate/High Low/Moderate Technical Skills Low/Moderate High Recurrence of problem Low Low or High* * Low for one-time studies High for models in continuous use
Marketing Engineering Software Excel Models Non-Excel Models Non-Excel Models by Commercial Vendors
Excel Models AdbudgAdvisorAssessorCallplanChoice-based segmentationCompetitive advertisingCompetitive biddingConglomerate, Inc. promotional analysisGE: Portfolio analysis Generalized Bass ModelLearning curve pricingPIMS:Strategy modelPromotional spending AnalysisResource allocation modelRevenue management for hotels Value-in-use pricingVisual response modeling Marketing Engineering Software
Non-Excel Models ADCAD: Ad Copy DesignCluster AnalysisConjoint AnalysisMultinomial Logit AnalysisPositioning Analysis Non-Excel Models by Commercial Vendors Analytic Hierarchy ProcessDecision Tree AnalysisGeodemographic Site PlanningNeural Net for Forecasting Marketing Engineering Software
ME Topics/Software • General Tools (Chapters 1 and 2): • Introduction to Excel-based models • Visual response model development and calibration tool • Segmentation and Targeting (Chapter 3) • Hierarchical and k-means clustering (PDA case) • Discriminant analysis • Choice-based segmentation (ABB Electric case) • Positioning (Chapter 4) • Perceptual and preference maps (G20 case)
Topics (Cont’d) • Strategic Analysis: Concepts and forecasting (Chapter 5) • Regression/time-series (Bookbinders Book Club case) • Neural networks (Right Information Systems) – Bookbinders Book Club case • Multinomial Logit Analysis (Bookbinders Book Club case) • Models for Strategic Decision Making (Chapter 6) • Decision tree analysis (Treeage Software) – ICI case • Analytical hierarchy process (Expert Choice) – Jenny’s Gelato case • Norms-based analysis (PIMS) – Conglomerate, Inc. case • GE/McKinsey Portfolio Analysis model (Addison Wesley Longman case; Portfolio Analysis for Conglomerate, Inc. ) • Compete (Competitive Market Analysis) – Acme Liquid Cleanser exercise
Topics (Cont’d) • New Product Decisions (Chapter 7) • Conjoint analysis (Forte Hotel case) • Bass diffusion model (HDTV case) • ASSESSOR (Johnson Wax/Enhance Case) • Advertising and Communications Decisions (Chapter 8) • ADBUDG - Advertising budgeting (Blue Mountain Coffee Case) • ADCAD - Expert System for selecting ad execution themes (Johnson Wax/Enhance Case) • ADVISOR - Communications budgeting (Convection Company Case)
Topics (Cont’d) • Sales Force and Channel Decisions(Chapter 9) • CALLPLAN - Sales call planning (John French exercise) • ReAllocator (Syntex Labs Case) • Location analysis using geodemographic mapping (Scan US) – J&J Family Video case • Pricing and Promotion Decisions (Chapter 10) • Competitive bidding (ABCOR 2000 Account pricing exercise) • Learning curve pricing (Paving I99 exercise) • Value-in-use analysis (ABCOR 2000 price planning exercise) • Revenue management analysis (Forte Hotel Revenue Management exercise) • Promotions planning and analysis using Multinomial Logit estimation (Massmart, Inc. case) • Marketing Engineering: A look back and a look ahead (Ch 11)
FAQ’s Operationally….. • To learn software, reproduce tutorial, use FAQ, ask sensible marketing questions. (Separate technical questions from business questions.) • Will schedule lab session(s) if you wish—but we find you learn software on an “as needed” basis…let us know. • Save work as you go==> Keep Word open in the background and save details (copy/paste or Alt PrtScreen/Paste).
FAQ’s Strategically….. • It’s not about the software. It’s about solving business problems. Software is means and not end. Framing problems and asking the right questions is key. • Key output ==> empowered students prepared to change the way their employers view marketing.