Download
1 / 20
200 likes | 329 Views
3 test sites: 1.Belgrade GW Source 2. Pek River Catchment 3. Nisava River Catchment-Mediana site. Main characteristics of the Belgrade test area Test Area 18 includes 241 km 2 of lowland of the Sava Valley. There is one groundwater body of intergranular porosity.

E N D
3 test sites: 1.Belgrade GW Source 2. Pek River Catchment 3. Nisava River Catchment-Mediana site
Main characteristics of the Belgrade test area • Test Area 18 includes 241 km2 of lowland of the Sava Valley. • There is one groundwater body of intergranular porosity. • It is largely recharged by the Sava River and discharged via the wells of the Belgrade Groundwater Source (4-5 m3/s). Proposed Natura 2000 sites Map showing groundwater level contours in October 2008 Nominated Natura 2000 sites
Methodology, simplifications and assumptions • The elements of the water balance were integrated by hydrodynamic calculations using MODFLOW 2000 software • Main simplifications and assumptions • River Sava -studied aquifer contact will retain const. (conductance of the river bottom is constant) • The boundary condition in the disregarded portion of the area is predominantly under the influence of vertical water balance parameters -climate parametars • The current status of the proposed Natura 2000 sites is a result of the groundwater regime (the impact of irrigation/drainage canals is small or negligible).
Reference value for 1961-90 • Model calibration, validation and sensitive analisys – done for the 2005-2008 with needed opservations – data for river water fluctation, water abstraction, ground water level fluctation, temperature, precipitation, evapotranspiration GW recharge, • Reference status of the GWB – GW levels at selected sites (ecological criteria) in 2008 year. Future – estimated value • Selection of representative periods - Long-term (8 to 10 years) average amounts of precipitation – MINIMUM • As a result, the 2021-29 period was deemed to reflect the representative state for 21-50 period, and the 2093-2100 period to reflect the average state for 71-100. • GW calculations -Hydrodynamic analyses using modified boundary conditions derived on the basis of precipitation and temperaturein future periods.
Empirical functions were used for the correlation between precipitation and “potential” infiltration by month. The rate of evaporation from grassland at ground level was computed applying a modified Penman method. Effective infiltration was computed using the hydrodynamic model, as the difference between a given potential infiltration rate and the computed rate of evaporation from the water table, as a function of the depth-to-groundwater. • Based on the correlation between PET and temperature levels by month, it was assumed that the current correlationcan be used to predict future potential evapotranspiration. According to these data, the effect of temperature on PET is more pronounced between May and October (fig.1a). • For future estimation of the ETo at critical periods, the “registered” historical value was selected. Based od the average annual temperature and average summer temperatures in future periods, and the closest recorded (with all data needed) values, ET0 in the prognostic calculationswas adopted. Specifically, 1994 is the representative year for the 2021-2050 period, and 2000 is the representative year for the 2071-2100 period. Potential infiltration (mm/month) Precipitation (mm/month) Correlation between recorded temperatures and PETo-Penman (Fig 1a) and correlation between precipitation and infiltration by month (fig 1.b)
Water demand of the ecosystemsThe ecosystem demand is associated with the need to maintain favorable groundwater levels in the forest zones (Bojčinska Šuma and Crni Gaj), and to conserve the groundwater regime which affects the extent of water losses due to infiltration from the Živača Pond.The extent to which these conditions may vary due to climate change is shown via duration curves for reference parameters, water levels for the forests and the rate of infiltration for the Živača Pond. Graphics were prepared for the year 2008, which is representative of a sustainable state, and the average, synthetic year which represents the 2021-50 period, and finally the 2071-2100 period.
Results With regard to the analyzed aquifer (or water resource), no variation in water availability for drinking water supply is expected in view of the configuration of the water source and the size of the river from which the aquifer is predominantly recharged. However, an analysis of the potential impact of climate scenarios on the forested areas classified as Natura 2000 sites, shows a different picture. Based on graphically interpreted groundwater levels at these sites, a significant impact may be expected in the Bojčinska Šuma area, which is at a relatively large distance from the Sava River and the wells of the Belgrade Groundwater Source. Computed water level duration curves for Crni Lug and Bojnička Šuma (2008 state and two future states - 2021-2050 and 2071-2100). GW levels (a.s.l.) GW levels (a.s.l.) Duration (%) Duration (%)
Main characteristics of the artificial recharged source “Mediana” test area -the Nisava river catchment The size of the Nisava river catchment area is 4,086 km2, of which 1,096 km2 is in Bulgaria (transboundary river) Maximum capacity -600 l/s
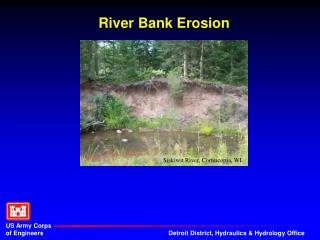
Sensitivity to Climate Change (observed indicators) Floods: On 27 November 2007, the Nišava flooded farmland in the Village of Dolac, at the entrance to the Sićevo Gorge (Serbia Waters, 2007). Droughts: Spatial distribution of drought in 1990(a) and 2000(b), and severity expressed in terms of SPI. (Spasov et al.)
Methodology, simplifications and assumptions - base line period 1961-1990, validation period 1991-2006 (real climate data from 8 stations) - Estimation of future monthly discharges for periods 2021-2050 and 2071-2100 (precipitation and temperature given by BOKU University, corrected for higher altitude stations), - water balance elements: WATBAL model (1961-1990), MODFLOW (“Mediana” test site), for future evapotranspiration – Empirical equation (depending on T, P) – calibrated for 1961-1990 (Isailovic et al. 2010). - For estimation of average monthly discharges – future period (till 2100) is used Model VNC (developed in Institute Jaroslav Cerni) – non linear correlation model - outputs – GIS maps, data base (monthly discharges, P, T, Q min.sust., …) Main simplifications and assumptions Mediana artificial recharged water source directly depending on the Nisava river discharges at profile of water intake Groundwater levels in Mediana test area are strongly dependent on water in infiltration lakes (feeding of that part of aquifer is stopped by permeable barrier and drainage system) Upstream multipurpose reservoir “Zavoj”, since the beginning of its operation has been used only for the production of electric power in the HPP “Zavoj” not for water supply and irrigation
Elements for surface water balance Precipitation in the Nišava River Basin Average annual temperatures in the Nišava River Basin Average runoff in the Nišava river basin Humidity in the Nišava River Basin
Multi-parameter non linear correlation model VNC • The model is based on the theory of non-linear standardized correlation • The essence of the VNC model is the establishment of linear correlations between standardized variables: • - Precipitation and temperature,independent variables • dependent variable is the discharge at the hydrological cross-section (at intake for water supply source “Mediana” – Nis gaug.stat. • The model boundaries were the actual boundaries of the river basin, and the exit cross-section was the Niš hydrological station located downstream from the Mediana water intake.
Results from VNC Model Average monthly precipitation and air temperature levels in the Nišava River Basin Average annual discharges of the Nišava River
2021-2050 and 2071-2100 Discharge forecasts for the Nišava River at Niš.
Available water for artificial recharged water source “Mediana” – at profil Nis (water intake) Criteria need to be fulfilled According to Serbian low,minimum sustainable flow must be provided downstream from a surface water intake, to ensure the survival and growth of downstream biocenoses and meet the water demand of downstream users (Official Gazette RS 30/10). The minimum 95% average monthly discharge is used to derive this flow rate. For future periods 2021-2050 and 2071-2100 available discharge at Niš profile is calculated on the proposed formula : Qavailable = Q(time,p)_Nisava – Qmin.sus.flow_Nisava.
Results: • Qaverag.yearl. will decrease from 30.7 m3/s to 27.1 m3/s (the end of 2050.) as to 25.4 m3/s (in period 2071-2100). • Approximately 20% of available surface water will be lost with present water needs and efficiency of Zavoj accumulation • -Critical periods for Mediana test area will be summer months (July-August) in period 2021-2050 which will be extended to September and October at the end of 2071-2100 period • - Extreme events (droughts and floods) could make significant impact on water supply system NIVOS for Nis water supply (decreasing of karst spring discharges make pressure to Mediana test site also as increasing turbidity after heavy rain)
Conclusions for “Mediana” test site: ‘’Zavoj’’ reservoir shuold provide the required amount of water for water supply, and that the amount of water discharged from the reservoir after its hydro energetic potential has been used – regulated flow in the Nisava, meets the irrigation water demands in the Nisava basin and significantly affects the small waters enrichment in the dry seasons. Ecological criteria must be satisfied downstream from water intake Significant impact of Climate Changes on depending biodiversity may be expected in upstream part of Nisava river basin where are protected areas : the Sićevačka Klisura (Sićevo Gorge) and the Jelašnička Klisura (Jelašnica Gorge) Special Nature Reserve.