Download
1 / 18
180 likes | 340 Views
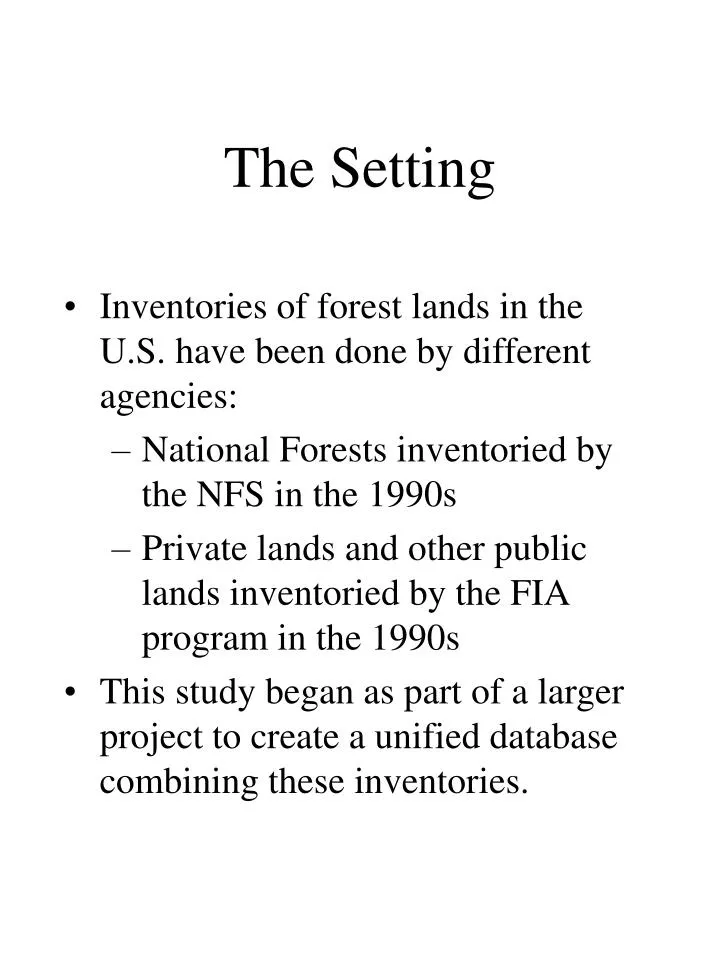
The Setting. Inventories of forest lands in the U.S. have been done by different agencies: National Forests inventoried by the NFS in the 1990s Private lands and other public lands inventoried by the FIA program in the 1990s

E N D
The Setting • Inventories of forest lands in the U.S. have been done by different agencies: • National Forests inventoried by the NFS in the 1990s • Private lands and other public lands inventoried by the FIA program in the 1990s • This study began as part of a larger project to create a unified database combining these inventories.
The Problem • The FIA program has estimated past 10-year individual tree diameter growth by • 1. Using repeat measurements • 2. Using diameter increments • 3. Using a growth model • The growth model used by FIA required input variables that were not collected on National Forest System inventory plots.
The Question • Can you find an acceptable method to estimate past 10-year diameter growth for trees? • For the inventories from the Colville, Deschutes, Fremont, Gifford Pinchot, Malheur, Mt. Hood, Mt. Baker-Snoqualmie, Ochoco, Okanogan, Olympic, Rogue River, Siskyou, Umatilla, Umpqua, Wallowa Whitman, Wenatchee, Williamette, Winema, Angeles, Cleveland, El Dorado, Inyo, Klamath, Lake Tahoe, Lassen, Los Padres, Mendocino, Modoc, Plumas, San Bernadino, Sequoia, Shasta Trinity, Sierra, Six Rivers, Stanislaus, and Tahoe National Forests. • By Friday.
NFS lands in Washington, Oregon, and California FVS variants in Washington, Oregon, and California
The Data • From California National Forests: • Plots: 4,400 • Trees: 161,000 • Increment cores: 19,000 • FVS variants: (1) Wessin, (2) Sornec, (3) ICSC, (4) Klamath • From Washington and Oregon National Forests: • Plots: 10,700 • Trees: 936,000 • Increment cores: 223,000 • FVS variants: (1) East Cascades, (2) West Cascades, (3) Blue Mountains, (4) Sornec and the (5) Pacific Northwest
The Method • Grow everything backwards 10 years using the FVS models. • Compare the “projections” to the measured diameter cores. • The “large tree growth model” in FVS • ln(dds) = HAB + LOC + b1cos(ASP)* SL + b2sin(ASP)*SL + b3 SL + b4 SL2 + b5 EL + b6 EL2 + b7 (CCF/100) + b8ln(DBH) + b9 CR + b10 CR2 + b11 (BAL/100) + b12 DBH2 • dds = dib22 – dib12 • dds = dib22 – (dib2 – DG)2 • where DG is 10-year inside bark diameter growth • DG = dib2 - (dib22 - dds)0.5
The Data Formatting HeadachesThe Thank You’s • Tommy Gregg and Carol Apple from Region 6 (OR and WA) of the National Forest System • Mike Landram from Region 5 • Don Vandendriesche and Gary Dixon from the Forest Service Fort Collins Service Center • Bruce Hiserote and Karen Waddell from FIA, PNW Research Station
The Results • (Very, very preliminary.) • ((Not for re-sale.)) • (((Feedback welcomed.))) Region 6 (Oregon and Washington). Measured DG = 1.15” averaged over 223,109 cored trees (sd = 0.95”) Predicted DG = 0.91” (sd = 0.59”) Region 5 (California) Measured DG = 1.57” averaged over 19,781 cored trees (sd = 1.27”) Predicted DG = 0.88” (sd = 0.88”) Note: For filling in missing values from the inventory, the bias is important, but the differences in variation are also important because of the effect on estimating confidence intervals.
Western Cascades variant • original data sources: • Gifford Pinchot National Forest • 1981 Inventory • Mt. Baker-Snoqualmie National Forest • 1976 Inventory • 1987 Managed Stand Survey • Mt. Hood National Forest • 1970 Inventory • 1971 Inventory • 1986 Inventory • 1987 Inventory • Rogue River National Forest • 1980 Inventory • Umpqua National Forest • 1968, 1969 Inventory • 1980 Inventory • Williamette National Forest • 1971 Inventory • 1981 Inventory • 1987 Managed Stand Survey • In contrast, the diameter cores for this study were taken from 1993 to 1997.
The Caveats(How I committed model abuse.) • I used cored diameter increments, not remeasured diameters. • Site index in OR/WA is created by plant association crosswalks. • The internal calibration of FVS was turned off. • The development data set had different plot designs & geographic locations. • Climate and weather do change. • Tree and stand characteristics also change over time.
Validation attempt #2: Using remeasurement data instead of diameter cores. Method: Grow plots forward in FVS for 10 years with internal calibration, compare to remeasured plots. Result for 114,000 remeasured trees: Real ave. DG 1.15”/decade Predicted ave. DG 1.01”/decade (88%)
Results by FVS variant for OR and WA National Forests CVS data, repeat measurements with internal calibration (~30% of all plots)
The real results: identification of needed research / analysis. • Checking the plant association crosswalk method to measured site index values. • Comparing growth predictions to remeasurement data. • Calibrating growth models to weather information. • Developing models for additional species. • Generate a discussion on formatting FIA plots for FVS modelling.
Why a national forest inventory program would care about growth modelling: • Filling in occasional measurements that were missed or were clearly in error. • Filling in measurements to allow subsampling in the field; lower cost of inventory. • Annual inventory system: 10% of all plots are measured each year using a 10-year cycle. Growth models could potentially contribute to providing current estimates from this system.