Download
1 / 17
190 likes | 347 Views
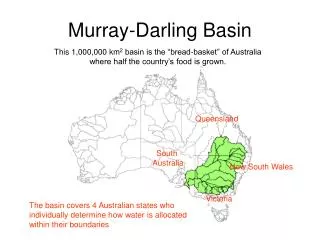
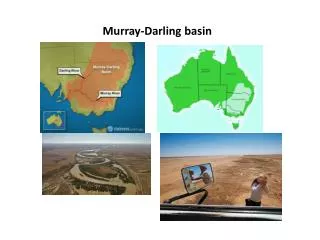
Developing the Basin Plan NatStats 2010 Conference Rob Freeman, Chief Executive Sydney, 16 September 2010. Murray-Darling Basin. Directly supports 3 million people. Feeds approximately 20 million people. Significant environmental values. 14% of Australia. Australia’s three longest rivers.

E N D
Developing the Basin PlanNatStats 2010 ConferenceRob Freeman, Chief ExecutiveSydney, 16 September 2010
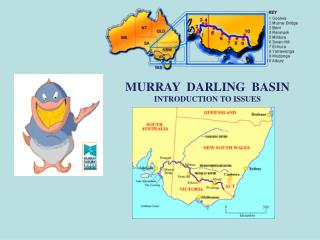
Murray-Darling Basin • Directly supports 3 million people. • Feeds approximately 20 million people. • Significant environmental values. • 14% of Australia. • Australia’s three longest rivers. • 40% Australia’s farmers. • Agricultural exports earn $9 bil/year. • Gross value of agricultural production $15 bil (40% Australia). • Home to 34 major Indigenous groups.
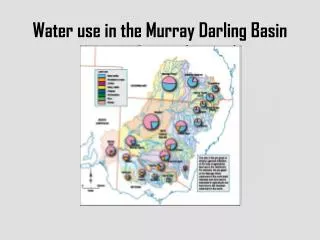
Current Planning (CSIRO Water Availability – 2008)
Key Elements of the Basin PlanPage 8 of the Concept Statement
Conceptual Cycle • Identify Key Environmental Assets and Key Ecosystem Functions. • Determine environmental water requirements of the Key Environmental Assets and Key Ecosystem Functions. • Calculate possible SDL. • Assess socio-economic impact. • Consider alternative scenarios. • Implement through Environmental Watering Plan. • Simplicity belies complexity.
Data Sets Ecological data Variable, multiple formats, different emphasis. Hydrological data Detailed, comprehensive. [CSIRO Sustainable Yields – foundation]. Social and Economic data The big challenge!
MDB Surface and groundwater models Warrego IQQM Nebine IQQM Paroo IQQM Lower Balonne IQQM St George SGCS13NT Barwon-Darling IQQM Middle Condamine IQQM Condamine MODFLOW Menindee IQQM Upper Condamine IQQM Bidgee IQQM Border Rivers MODFLOW Lower Bidgee MODFLOW Border R. and Mac B. IQQM Moonie IQQM Murray BigMod Lower Gwydir MODFLOW Murray MSM Gwydir IQQM Upper Namoi MODFLOW Eastern Mt Lofty Ranges 6*WATERCRESS Peel IQQM Namoi IQQM Lower Namoi MODFLOW Macq-Castlereagh 6*IQQM Southern Riverine Plains MODFLOW Macquarie MODFLOW Lachlan IQQM Wimmera REALM Mid-Lachlan MODFLOW Lower Lachlan MODFLOW Avoca REALM Daily Snowy SIM_V9 Weekly ACTEW REALM GSM REALM Monthly Upper Bidgee IQQM Ovens REALM Mid Bidgee MODFLOW
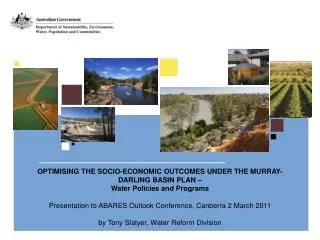
The Role of Social and Economic Data • Describe the social and economic fabric of the Basin [ABS / ABARE / BRS Report – Sep 2009]. • Understand the social and economic impacts of new public policy at community, regional, Basin, State and National levels. • Communicate these impacts using common metrics and analysis at these scales. • ‘Best available scientific knowledge and socio-economic analysis’ (Water Act 2007).
Data Challenges • Disaggregate national and state economic data to better understand community and regional contributions. • Aggregate local social data to State, Basin and National impacts. • Effort to re-aggregate existing data for a ‘non-standard geography’ (to ABS) that was still under development (by MDBA). • Evolution of boundaries impeding time-series analysis. • Increasing number of boundaries – CSIRO, Natural Resource Management (CMA’s), water catchments, Basin Plan regions, ABS geography.
Data Challenges ABARE AusRegion MDB regions (comparison with WTM regions)
The currency of data • ‘Best Available’ agricultural and population data relates to 2005-06. • Much of the exiting analysis and underlying data for models relates to 2006 or 2001. • Challenging to look forward to what might happen when data could already be considered old. • For example, the drought has reportedly changed the face of much of rural Australia in the last 5 years but the data won’t reflect this, as yet.
Data issues • High expectations of social and economic data. • Economic data and modelling is designed for national and State purposes but we need to understand the flow on to local and regional areas. • As we extend the use of data at what point are we left with assumptions and no data. • Yet it is increasingly important to more fully understand a local areas contribution to the national wealth. • Concern that once local area data is aggregated the human dimension is lost.
How did we progress? • Took advice early – ABS and ABARE were two of the first agencies contacted. • Allowed the ABS to do what they do best – producing the Context statistical report for the Basin (with ABARE and BRS). • Sought regular ongoing advice on developing the short and long term data needs for the Basin plan. • An active dialogue with the ABS (and others) to progress the issues raised.
The Future • Strengthening strategic alliances to improve statistical data in the Basin. • Defining data needs early to meet future requirements (Monitoring and Evaluation). • Better using opportunities (Agricultural Census, Agricultural Survey). • Identifying less obvious opportunities (cross agency agreed priorities, question design).
Feedback www.mdba.gov.au