Download
1 / 22
230 likes | 338 Views
Harmonics of 351 d evident in all IGS products origin still unknown: local multipath or GPS orbits ? Study orbital response due to IERS diurnal & semi-diurnal ( subdaily ) EOP tide errors

E N D
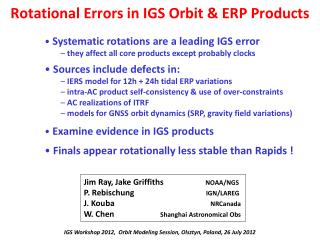
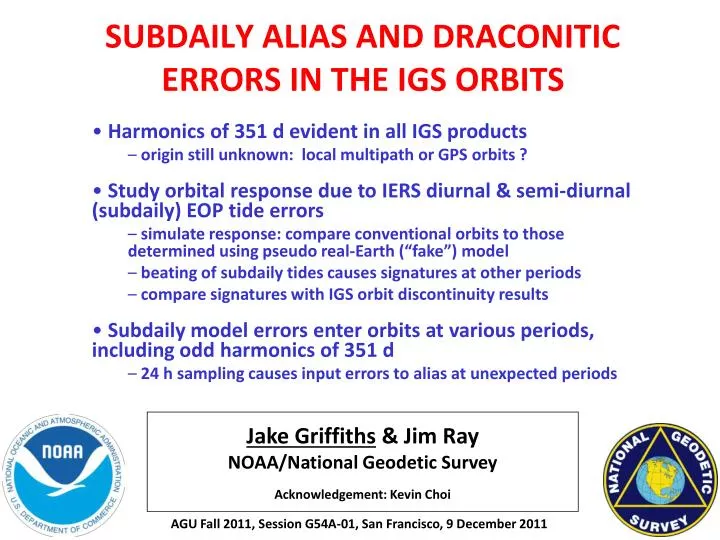
Harmonics of 351 d evident in all IGS products • origin still unknown: local multipath or GPS orbits ? • Study orbital response due to IERS diurnal & semi-diurnal (subdaily) EOP tide errors • simulate response: compare conventional orbits to those determined using pseudo real-Earth (“fake”) model • beating of subdaily tides causes signatures at other periods • compare signatures with IGS orbit discontinuity results • Subdaily model errors enter orbits atvariousperiods, includingoddharmonics of 351 d • 24 h sampling causes input errors to alias at unexpected periods SUBDAILY ALIAS AND DRACONITIC ERRORS IN THE IGS ORBITS Jake Griffiths & Jim Ray NOAA/National Geodetic Survey Acknowledgement: Kevin Choi AGU Fall 2011, Session G54A-01, San Francisco, 9 December 2011
Harmonics of GPS Draconitic Year are Pervasive dE • GPS-sun geometry repeat period • “draconitic” year = 351.2 d • 1st & 2nd harmonics overlay • seasonal signals • IGS station coordinates (2006) • in all dNEU components • up to at least 6th harmonic • later found in all IGS products: • “geocenter” variations • polar motion rates (esp 5th & 7th) • LOD (esp 6th) • orbit discontinuities (esp 3rd) • strong fortnightly signals also common • signals clearer in reprocessed results dN % of GPS Stations dU Frequency (cycles per year) (from X. Collilieux et al., 2011) 02
Possible Origins of Draconitic Signals • 1) local multipath effect at stations • station-satellite geometry repeats every sidereal day, approximately • 2 GPS orbital periods during 1 Earth inertial revolution • actual GPS repeat period = (1 solar day - ~245 s) • sidereal period (K1) = (1 solar day - 235.9 s) • for 24-hr sampling (e.g., data analysis), alias period → GPS draconitic year • 2) mismodelling effect in satellite orbits • empirical solar radiation parameters intrinsically linked to orbital period • but no precise mechanism proposed yet • this presentation examines impact of errors in a prioriIERS model for subdaily tidal EOP variations on GPS orbits • EOP tide errors at ~12 hr couple directly into GPS orbit parameters • EOP tide errors at ~24 hr may couple into other estimates • subdaily EOP total magnitudes are ~1 mas = 13 cm shift @ GPS • IERS model is known to have visible errors, which could reach the 10 to 20% level 03
Simulate Impact of Subdaily EOP Errors • process ~3 years of GPS orbits with IERS & “fake” models • “fake” model subdaily admittances differ by ~20% • model intended to mimic a real-Earth model • subdaily tides beat to generate spectral differences at other periods Power Density (mm2 / cpd) Frequency (cycles per day) 04
Simulate Impact of Subdaily EOP Errors • process ~3 years of GPS orbits with IERS & “fake” models • difference conventional & EOP-test orbits @ 15 min intervals • compute spectra of differences for each SV, stack & smooth • compare spectral differences: input model errors vs. orbital response Power Density (mm2 / cpd) Frequency (cycles per day) 04
Simulate Impact of Subdaily EOP Errors • process ~3 years of GPS orbits with IERS & “fake” models • difference conventional & EOP-test orbits @ 15 min intervals • compute spectra of differences for each SV, stack & smooth • compare spectral differences: input model errors vs. orbital response long-period errors absorbedmostly by daily EOPs, not orbits Power Density (mm2 / cpd) Frequency (cycles per day) 04
Simulate Impact of Subdaily EOP Errors • process ~3 years of GPS orbits with IERS & “fake” models • difference conventional & EOP-test orbits @ 15 min intervals • compute spectra of differences for each SV, stack & smooth • compare spectral differences: input model errors vs. orbital response short- period errors go into orbits Power Density (mm2 / cpd) Frequency (cycles per day) 04
Simulate Impact of Subdaily EOP Errors • process ~3 years of GPS orbits with IERS & “fake” models • difference conventional & EOP-test orbits @ 15 min intervals • compute spectra of differences for each SV, stack & smooth • compare spectral differences: input model errors vs. orbital response Power Density (mm2 / cpd) bump in background power – resonance of ~2 cpdsubdaily tide errors and GPS orbital period? Frequency (cycles per day) 04
Spectra of Orbital Responses toSubdaily EOP Errors – Near 1 cpd • at diurnal period, EOP model errors absorbed into orbits, esp cross- & along-track only 2 subdaily tidal lines excited above background orbit noise unexpected peak in cross-track – probably a beat effect Power Density (mm2 / cpd) Frequency (cycles per day) 05
Spectra of Orbital Responses toSubdaily EOP Errors – Near 2 cpd • at semi-diurnal period, EOP model errors absorbed mostly into orbit radial (via Kepler’s 3rd law) Power Density (mm2 / cpd) Frequency (cycles per day) 06
Compare Simulated EOP Signatures with IGS Orbits • Basic problem is lack of an independent “truth” for IGS orbits • but can compute discontinuities between daily orbit sets • doing so aliases subdaily differences into longer-period signals • to compare, also compute EOP-induced orbit differences once daily • IGS ORBIT JUMPS • fit orbits for each day withBERNE (6+9) orbit model • parameterize fit as plus 3 SRPs per SV component • fit 96 SP3 orbit positions for each SV as pseudo-observations for Day A • propagate fit forward to 23:52:30 for Day A • repeat for Day B & propagate backwards to 23:52:30 of day before • compute IGS orbit jumps at 23:52:30 • SIMULATED EOP SIGNATURES • difference conventional & EOP-test orbits at 23:45:00 only • Compute IGS orbit jumps over ~5.6 yr, test orbits over ~2.8 yr 07
IGS orbit jumps computed from Berne model fit to adjacent days • compute spectra for each SV orbit jump set, stack & smooth • “calibrated” for errors due to (fit + extrapolation) method Spectra for IGS orbit jumps & EOP-test orbit diffs Power Density (mm2 / cpd) Frequency (cycles per day) 08
background power follows ~flicker noise on seasonal time scales • bands at 29, 14, 9 & 7 d; peaks offset from expected periods • excitation at harmonics of GPS draconitic year Spectra for IGS orbit jumps & EOP-test orbit diffs peaks at mostly odd harmonics of GPS draconitic Power Density (mm2 / cpd) most peaks in ~29, ~14, ~9 and ~7 d bands do not coincide with aliases of subdaily EOP tidal errors for simple daily sampling Frequency (cycles per day) 08
Spectra for IGS orbit jumps & EOP-test orbit diffs • conventional GPS orbits using IERS model • EOP-test orbits using pseudo real-Earth (“fake”) model • spectra of orbit differences computed at 23:45:00 Power Density (mm2 / cpd) background power is relatively flat, with bumps at seasonal time scales Frequency (cycles per day) 08
Spectra for IGS orbit jumps & EOP-test orbit diffs • offset peaks in ~14, ~9 and ~7 bands due to simple daily sampling of input errors Power Density (mm2 / cpd) Frequency (cycles per day) 08
Spectra for IGS orbit jumps & EOP-test orbit diffs • aliasing subdaily errors responsible for some harmonics of 351 d • peaks at other harmonics likely caused by aliasing of other errors other harmonics -- aliasing of other errors 1st, 3rd, 4th, & 10th harmonics also caused by subdaily EOP errors Power Density (mm2 / cpd) Frequency (cycles per day) 08
Summary & Conclusions • Harmonics of 351 d pervasive in all IGS products • Simulated orbital response to IERS subdaily EOP tide model errors • compared conventional orbits to EOP-test orbits at 15 min intervals • Beating of subdaily EOP tides causes spectral differences at other periods • long-period errors go into EOPs • short-period errors go mostly into orbits • bump in background noise at 2 cpd -> resonance with GPS orbital period • Compared IGS orbit discontinuities to EOP-test orbit differences at 23:45:00 • 24 h sampling causes subdaily EOP tide errors to alias at ~14, ~9 and ~7 d bands -> peaks offset from expected periods • peaks at several (mostly odd) harmonics of 351 d • IERS diurnal & semi-diurnal tide model errors are source for subdaily alias and somedraconiticerrors in IGS orbits 09
Spectrum of Daily EOP Differences due to Subdaily EOP Tidal Model “Errors” • M2 aliases into PM-x and PM-y; O1 aliases into LOD • 1stdraconitic harmonic enters PM-x & LOD Power Density (mas2 or s2/ cpd) Frequency (cycles per day)
Spectra of Orbital Responses toSubdaily EOP Errors – Near 3 cpd • background power is lower • errors absorbed in all three components Power Density (mm2 / cpd) Frequency (cycles per day)
Spectra of Orbital Responses toSubdaily EOP Errors – Near 4 cpd • same near 4 cpd Power Density (mm2 / cpd) Frequency (cycles per day)