Download
1 / 53
610 likes | 892 Views
Unit 1: Ecosystem Sustainability. Wolf Island. 1.1 Capturing Energy from the Sun. Definitions Ecosystem - all the living (biotic) and non-living (abiotic) parts in an environment that interact. Trophic levels - feeding levels. Food Chains. Food Chains.

E N D
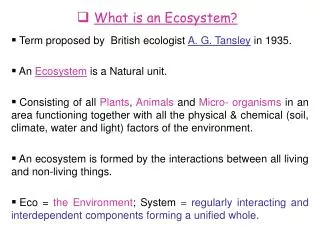
1.1 Capturing Energy from the Sun • Definitions • Ecosystem - all the living (biotic) and non-living (abiotic) parts in an environment that interact. • Trophic levels - feeding levels.
Food Chains • Show the patterns of energy movement through an ecosystem. Grass grasshopper frog wolf Plants Herbivore Carnivore Top Carnivore Producer Primary Secondary Tertiary Consumer Consumer Consumer 1st 2nd 3rd 4th Trophic Trophic Trophic Trophic Level Level Level Level
Producers convert solar energy into chemical energy for the food chain. (don’t eat other organisms – some exceptions) All energy for life is powered by the Sun.
All energy needed by consumers must be made by producers by photosynthesis. CO2 + H20 CHO + O2 (Cycle of Life) Solar Energy
Why does energy decrease as you up the trophic levels? (gr 7?) • Used for life processes. • Assignment • Read p4 – 7 • Stretch Your Mind P 5 • pg 7 #1 – 6
1.2 Feeding Levels • Scavengers – animals that eat large dead animals. (gr 7) • Detrivores – small creatures that eat small dead animals, plants and dung. (Eg. crabs, earthworms, maggots, some ants.)
Decomposers • a type of detrivore that eats the last small amount of the dead material. (includes bacteria and fungi.) (gr 7)
Food Chains based on the Dead • Eg) • grass cows (dung) beetles garter snake owl • food chains with abiotic elements outnumber those without.
Pyramid of Numbers • usually the number of organisms decrease up trophic levels. • Amount of energy decreases as you go up each level • 1st level has the most energy • draw pyramid on pg 14.
Reversed Pyramid of Numbers • Most animals/carnivores are larger than the prey they eat - exceptions • a single LARGE producer (tree) may provide food for many insects • draw pyramid on pg 15.
Pyramid of Biomass Def’n. • Biomass (the amount of mass of living material) • Biomass more accurately tells the amount of producer material supporting higher trophic levels than numbers do. • Why doesn’t the ocean system collapse? • Phytoplankton reproduce faster than zooplankton can eat them • Zooplankton reproduce faster than fish can eat them • Draw diagram on p 16
Inverted Pyramid of Biomass • Occurs only when the producers reproduce REALLY fast. • Eg) a few phytoplankton can be enough food to support the much heavier zooplankton. • Draw diagram on p 16
Pyramid of Energy Flow Most Energy Least Energy • producers 1°consumers 2°consumers 3°consumers • Usually about 10% of the energy goes to the next level. (the rest used for life processes) • Chains are rarely more than 4 links long. • Draw diagram on p 17
World Food SupplyEating Grain rather than Meat • World agriculture is trying to shorten food chains. Why? • See BLM 1-14
Pyramid of Energy Flow Assignment • Copy diagrams on p 14-17 • BLM 1-1, 1-2, 1-3, 1-4, 1-5, 1-6, 1-9, 1-11, 1-12, & 1-14 • Read pg 8 – 17 & do pg 17 #1 - 5
1.3 Populations • Populations – groups of individuals of the same species. • Killer Whales p 18 • Carrying Capacity – the largest population of a species that an environment can support.
Carrying Capacity Carrying Capacity is affected by: • higher trophic level: number of predators • lower trophic level: amount of food available - Fox and rabbit cycle
Carrying Capacity (cont’d) Carrying Capacity is affected by: • availability of materials and energy: • water, essential materials • competition: when populations grow individuals must compete with each other for food, mates, water, shade, etc.
Competition • intraspecific competition – occurs within the same species. • interspecific competition – occurs between 2 different species with the same needs. Eg) wolves, pumas, coyotes compete for deer.
Population Density • The number of individuals that can live in an area at one time. • some animals need more room than others. • crowding causes: • aggression • neglect of young • spread of disease or parasites
Density-dependent • Since items 1 – 3 depend on how crowded the animals are they are density-dependent factors. • These increase in significance as the population increases • density-independent factors don’t depend on population but affect population anyway. • Eg) floods, droughts, or fires.
Assignment • Read p 18-24 • Do CYU pg 24 #1-6 • BLM 1-17
Bioaccumulation • The tendency of pollutants to become more concentrated as you move up the food chain (trophic levels). • The pollution often damages or kills the organism because it is often poisonous.
Steps: • Plants work hard to take in nutrients and water (containing pollution) and use or store them. Pollution is stored accidentally and becomes concentrated. • Since most energy is lost between trophic levels, herbivores must eat a LOT of plants. The pollution is usually stored in the fats of the herbivores.
Steps (cont’d) • If the herbivore is caught and eaten, its fat is digested and the pollutant moves to the fat of the new consumer. The consumer must eat many herbivores in order to survive. Example: • Grass sprayed with chemical • Mouse eats eats grass • Hawk eats mouse
The DDT Story – Read pg 30-31 and do pg 32# 1-11 • Read pg 25-34 and do pg 34 1-6
The DDT Story • DDT is sprayed on plants, they absorb it and it becomes part of their structure. • The organisms with the most DDT are dolphins with 5200 ppb.
The DDT Story • The dolphins are in the 3rd/4th trophic level. • The higher an organism is in the food chain, the more concentrated the DDT will be in its body.
The DDT Story • The DDT is 430,000 times greater in the fish than in the seawater (43/0.0001) and 52 M times (5200/0.0001) greater in the dolphins.
The DDT Story • Animals at the top of the food chain are at a much greater risk because they are consuming prey that have high concentrations of the poisons in their tissues from eating contaminated organisms.
The DDT Story • DDT can affect organisms far away from the source because of: • Migration (migratory birds) • Large range (hawks)
The DDT Story • All organisms have a certain amount of permanent body fat. Because DDT doesn’t break down it eventually affects the organisms DNA. Affected cells may become cancerous. Desirable characteristics would be: • Water soluble • Shorter shelf life • Affected only the target pest
The DDT Story • DDT could have killed an insects competitors so its population could grow unchecked.
The DDT Story • Answers are: • Seabirds over the Bay of Fundy have higher levels of DDT. Reasons include: • Atlantic ocean is further from agricultural areas • Seabirds food higher concentrations in B of F • Pesticide levels seem to have decreased between the late 60’s and early 80’s. DDT was banned in 1969. • Different level of body fat. Feed on larger prey
In order for a pollutant to bioaccumulate it must be: • Long-lived. • Concentrated by the producers. • Fat-soluble.
Make notes on the harmful effects of the following toxins: • DDT • Lead • Dioxin • PCB’s • Mercury
DDT • Used to control mosquitoes and lice in the 50’s. • Not absorbed readily by human skin. • Controversy over effect on humans • Stays in human fat, especially breast milk. • Thinned eagle (birds of prey) egg shells • Should it still be used today?
Lead • Roman aquaducts • Historically found in gasoline, house paint, pesticides, solder, fish wts., & ammunition • Anemia, N.S. damage, kidney damage, etc. • Most serious in pregnant women (miscarriage/stillbirth) and young children (more easily absorbed)
Dioxin • One of the most toxic chemicals • Industrial by-product involving Cl compounds. (paper bleaching, agent orange, etc.); Love Canal, ON • Incinerating chlorinated wastes • Carcinogen (causes cancer) • Reproductive & developmental problems, Immune system damage, regulatory hormone interference • Source - fish
PCB’s • Non-flammable, chemical stability, high boiling point, & electrical insulating properties – very useful • Light ballasts • Carcinogens, immune system, rep’ve system, NS, etc.
Mercury • Ingested, inhaled or absorbed through skin • CNS and kidney damage • Memory loss, hallucinations, tremors • Pregnant women and children at greater risk • Fish is major source