Download
1 / 35
350 likes | 442 Views
Homework #3 Examples Energy Update! Research/Paper Proposal Due this Wednesday (consult syllabus) Mid Term 3/12/14, study guide the class before Review Last Lecture 8 Fossil Fuels Nuclear Energy Today’s Material: Lecture 9 Nuclear Energy Activity 3.

E N D
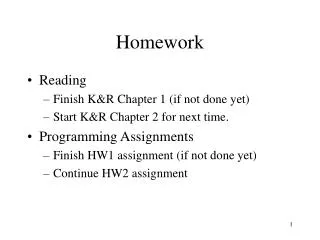
Homework #3 Examples • Energy Update! • Research/Paper Proposal Due this Wednesday • (consult syllabus) • Mid Term 3/12/14, study guide the class before • Review Last Lecture 8 • Fossil Fuels • Nuclear Energy • Today’s Material: Lecture 9 • Nuclear Energy • Activity 3
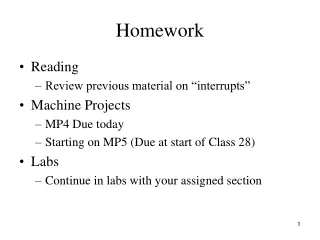
http://www.independent.co.uk/environment/climate-change/now-the-two-most-famous-scientific-institutions-in-britain-and-the-us-agree-climate-change-is-more-certain-than-ever-9155396.htmlhttp://www.independent.co.uk/environment/climate-change/now-the-two-most-famous-scientific-institutions-in-britain-and-the-us-agree-climate-change-is-more-certain-than-ever-9155396.html http://royalsociety.org/uploadedFiles/Royal_Society_Content/policy/projects/climate-evidence-causes/climate-change-evidence-causes.pdf “The speed of global warming is now 10 times faster than at the end of the last ice age, which represents the most rapid period of sustained temperature change on a global scale in history - and there is no end in sight if carbon emissions continue to increase.” “climate change is now more certain than ever and that many lines of evidence point to human activity as the cause.” “Some areas of active debate and ongoing research include the link between ocean heat content and the rate of warming, estimates of how much warming to expect in the future, and the connections between climate change and extreme weather events” A boat is seen among the icebergs that broke off from the Jakobshavn Glacier in Ilulissat, Greenland
Formation of an oil deposit in a geological structure called an anticline, in which rock layers have bent upward. The oil originally forms in the source rock, then migrates upward through the porous layer to collect at the top, where it is trapped by the overlying impermeable rock. Natural gas may collect above the oil. http://earththeoperatorsmanual.com/segment/3
Simplified diagram of the fractional distillation process used in oil refining, showing temperatures at which different products condense out of the distillation column.
http://www.eia.gov/todayinenergy/detail.cfm?id=4390 Source: U.S. Energy Information Administration, International Energy Statistics. Note: With about 15 million short tons in total consumption, the Middle East was by far the smallest coal-consuming region and was too small to show on the map. In the animation, the line chart at the bottom shows the annual production of coal by region in billion short tons.
http://en.wikipedia.org/wiki/File:Oil_Reserves.png 15 June 2009
http://theallaroundoilman.blogspot.com/2010/10/oil-and-gas-map-of-texas.htmlhttp://theallaroundoilman.blogspot.com/2010/10/oil-and-gas-map-of-texas.html
http://en.wikipedia.org/wiki/Peak_oil Peak oil, an event based on M. King Hubbert's theory, is the point in time when the maximum rate of petroleum extraction is reached, after which the rate of production is expected to enter terminal decline. Choosing a particular curve determines a point of maximum production based on discovery rates, production rates and cumulative production. Early in the curve (pre-peak), the production rate increases because of the discovery rate and the addition of infrastructure. Late in the curve (post-peak), production declines because of resource depletion. http://en.wikipedia.org/wiki/Hubbert_peak_theory
“Solar system” model of the helium atom, with a nucleus consisting of two protons and two neutrons.
http://www.windows2universe.org/physical_science/physics/atom_particle/atomic_mass.htmlhttp://www.windows2universe.org/physical_science/physics/atom_particle/atomic_mass.html Here you can see an example of atomic weight, atomic number, and mass number. The atomic number is the smaller number associated with the element and is equal to the number of protons in the nucleus. http://avonapbio.pbworks.com/w/page/9429249/Atomic%20Number%20and%20Atomic%20Mass
Alpha Decay of a Uranium-238 Nucleus 4 He 2 Parent Nucleus Emitted Particle Key ProtonNeutron Decay Event 238 234 Th U Daughter Nucleus 92 90 What is Radiation? • Radioactivity is a natural and spontaneous process by which the unstable atoms of an element emit or radiate excess energy • Radiation is the result • Alpha Decay - Alpha decay occurs when the nucleus spontaneously ejects an ά particle. An ά particle is really 2 protons and 2 neutrons, or an Helium nucleus.
Decay Products • Beta Decay - An excess of neutrons in an atom's nucleus will make it unstable, and a neutron is converted into a proton to change this ratio. During this process, a ß particle is released, • Gamma ray emission usually occurs with ά and ß emission. Gamma rays have no charge or mass, so their emission doesn't change the chemical composition of the atom. Instead, it results in a loss of radiant energy. Gamma ray emission occurs because the nucleus is often unstable after ά and ß decay.
Decay of a radioactive sample containing initially 1,000 nuclei.
The curve of binding energy, a plot of binding energy per nucleon versus mass number. Individual isotopes may lie slightly off the general curve, as with He-4. Arrows indicate the energy-releasing paths of nuclear fusion and fission.
Neutron-induced fission. (a) A neutron strikes a heavy nucleus and is absorbed. (b) The nucleus begins to oscillate. (c) It takes on a dumbbell shape, and the repulsive electric force begins to dominate. (d) The nucleus fissions into two unequal middleweight nuclei, emitting several neutrons in the process.
A nuclear chain reaction. At left, a neutron strikes a U-235 nucleus, causing it to fission and, in this case, release two neutrons that go on to cause two additional fissions. Each of those fission events releases neutrons that cause more fission, and the chain reaction grows exponentially. This is what happens in a bomb. In a reactor, the neutrons are carefully controlled to ensure that, on average, each fission results in only one additional fission.
Nuclear fuel cycles. A once- through cycle is in black; additional steps in a reprocessing cycle are in gray. On-site storage involves pools of water for short-term storage of fresh, highly radioactive waste, followed by longer-term dry cask storage.
A hill-and-valley analogy for fusion. It takes substantial energy to get the ball up the hill, but a lot more is released when it drops into the valley.
The deuterium–tritium fusion reaction of Equation 7.3 produces a helium nucleus (He-4), a neutron, and energy.
Class Review: • Nuclear Energy • Next Class • Nuclear Energy • Terra and Luna