Download
1 / 23
230 likes | 367 Views
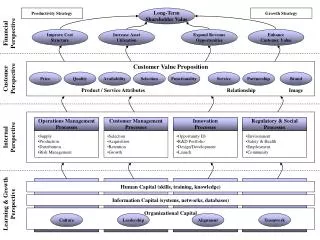
Shareholder Value versus CO 2. Agenda. Emission basics History and sector data Drivers and incentives Industrial Cogeneration Conclusion. CO2-emissions basics. E = MC 2 MC 2 = CO 2 E = CO 2 ( 66 %) 1 kWh = 3.6 MJ An average EU citizen produces 9100 kg/y CO 2

E N D
Agenda • Emission basics • History and sector data • Drivers and incentives • Industrial Cogeneration • Conclusion
CO2-emissions basics • E = MC2 • MC2 = CO2 • E = CO2 ( 66 %) • 1 kWh = 3.6 MJ • An average EU citizen produces 9100 kg/y CO2 • 1 GJ of heat produces 62 kg CO2 • 1 kWh ( electrical energy) requires 2.5 kWh of thermal • energy and produces 0.56 kg CO2
CO2-emissions history Source : Energy in Europe 1997
EU CO2 Sectors Source : Energy in Europe 1997
EU CO2 Sectors Source : Energy in Europe 1997
EU Transport • Positive effects • train push • ? • Negative effects • Increase transportation • E-commerce/ Internet • Congestion's • Alternatives ?
EU Power Gen Source : Energy in Europe 1997
EU Power Gen • Positive effects • Efficiencies are increasing • Switch to gas • Negative effects • Deregulation's • Pressure on nuclear Source : Energy in Europe 1997
EU Domestic&Tertiary • Positive effects • Awareness • Tremendous untapped • potential • Business opertunity • Negative effects • Deregulation’s • Long term contracts
EU Industry Source : CoGen Europe 1999
EU Industry Source : CoGen Europe 1999
EU Industry Source : CoGen Europe 1999
EU Industry • Positive effects • Awareness • Marketing issue • Tremendous untapped • CHP potential • Negative effects • Deregulation • ROI/IRR • Fierce competition
What does Wall Street demands ? • Increase growth and market share • Increase profitability • Increase the price • Lower the cost • Digitalisation/Automation • Globalisation • Outsourcing of services/assets • Energy
Energy Cost Reduction Optimise energy generation Savings 5-35 % Optimise distribution Optimise consumption
Saving Examples • University of Cologne GE $ 145.000 • Glan Hafren Hospital UK $ 800.000 • Honeywell Emmen NL $ 150.000 • Otrokivice District Heating CZ $ 700.000 • Siklos District Heating HU $ 100.000 • Krakow POL 33 % energy reduction • Martin District Heating SLOV $ 350.000 • Tushino Russia $ 1.100.000 • Kiev Ukraine $ 30.000 ( 1 out 1600 buildings) • Beijing China savings +/- 30 % • Hanvit Bank Korea $ 570.000 • Inland Revenue US $ 100.000 • Paint Shop Mexico $ 80.000
Recent CHP references • 540 MWe CHP Netherlands • 300 MWe CHP Scottland • 200 MWe CHP Czech Rep • 180 MWe CHP Hungary • 150 MWe CHP UK • 120 MWe CHP Poland • 110 MWe CHP Finland • 100 MWe CHP Germany • 100 MWe CHP France • 40 MWe CHP Spain • 25 MWe CHP Belgium
Summary • CO2 reduction is possible and can be implemented in short to • medium terms everywhere • Focus on co-generation (industry and buildings) to • capture the potential and to leverage existing technologies • A positive,substainable financial incentive and legal • framework is necessary to boost the process • NO TIME TO WASTE