Download
1 / 26
260 likes | 381 Views
WinTR-20 Calibration Procedures. Lesson Objectives. Determine the most appropriate level of WinTR-20 calibration effort warranted based on the scope of the project and available data.

E N D
WinTR-20 Calibration Procedures March 2009
Lesson Objectives • Determine the most appropriate level of WinTR-20 calibration effort warranted based on the scope of the project and available data. • Perform a non-complicated fully comprehensive (both peak rate and volume of runoff based) calibration using the Win-TR20 computer program. • Identify when a particular data set contains some data that cannot reasonably be calibrated to. March 2009
Why calibrate Win-TR20? • Initial estimates of input parameters (RCN, tc, Unit Peak Factor, etc) can be in error. • If project damage/benefit measurements are sensitive and climate/stream gage data exists then results may warrant calibration. • Calibrate to historical/known events, then run calibrated model with design criteria storms. March 2009
Should you calibrate WinTR-20 for a: • Grassed waterway? • 378 farm pond? • PL-566 urban channel? • Floodplain management study? Think of the need, gain, and effort involved as well as the quality of data available. March 2009
Calibration Basics • The extent of calibration effort depends on: • The purpose that the hydrologic model serves. • The amount and quality of data available for comparison purposes. March 2009
Simple Calibration • Involves matching Win-TR20 peaks to peak flow frequency curves of available crest stage data at a selected site. • Volumetric calibration not possible since only peak data exists. • Can be done with states’ recurrence flow regression equations, generally available through USGS (US Geological Survey). • Not optimal but sometimes it’s all you have. March 2009
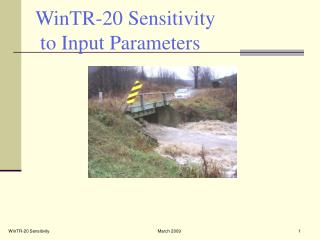
Simple Calibration (Continued) • See related lesson on Win-TR20 sensitivity. • The following parameters show increased sensitivity for peak flow calibration: • Time of Concentration • Unit Peak Factor • Runoff Curve Number IncreasingSensitivity March 2009
Typical WinTR-20 Calibration Procedure (with rain & stream flow data) Basic Concepts- • Use “identifiable” storms/runoff data. • Calibrate volumes first, then verify (on 2nd storm). • Calibrate peaks after volumes are calibrated then verify peak modeling (on 2nd storm). March 2009
Typical WinTR-20 Calibration Procedure Assumes the following adequate data is available: • stream gage • rainfall amount and distribution • flood history Major historical storms may not be desirable if recorded stream gage data is estimated and watershed and hydraulic conditions have changed. Pick storms in which the major runoff can easily be distinguished from the baseflow. March 2009
Typical Win-TR20 Calibration Procedure Pick the right storms to calibrate/verify with: • Select at least 2 calibration storms with the following characteristics: • Storms large enough to produce flooding. • Storms with essentially uniform rainfall distribution over the entire watershed. • Storms of a nature whose hydrograph can be easily distinguished from the stream gage data (typically isolated thunderstorms). March 2009
Typical Win-TR20 Calibration Procedure Calibration storm requirements continued: • Use recent storms if watershed conditions have changed or if hydraulic storage or flow characteristics have been altered (urban developments). • Pick storms that did not produce unusual hydraulic conditions (e.g. dam breach, obstruction developments, bypass of flows around the gage site, etc.). March 2009
Typical Win-TR20 Calibration Procedure Calibration storm requirements continued: • Calibration for a particular storm event will entail the input of the specific rainfall distribution into Win- TR20. This has significant impacts in matching the predicted to actual hydrograph shape. March 2009
Typical Win-TR20 Calibration Procedure • Estimate watershed hydrologic input parameters (RCN, Tc). • Perform a hydrologic analysis (Win-TR20) of the watershed using the above parameters and a gaged historical rainfall. See how the predicted volume of runoff compares to the historical volume. Historical storm hydrograph can be plotted to determine volume. March 2009
Typical WinTR-20 Calibration Procedure • If runoff volumes are vastly different, then look to the parameters that effect volume: RCN- Was this selected properly? RCN- What stage of growth was present when historical storm occurred? ARC- Was there a lot of rain prior to the historical event or maybe was it drier than normal (be aware of how ARC is assigned)? March 2009
Typical Win-TR20 Calibration Procedure • (continued) Input parameters that effect volume: Drainage Area- Was the whole area contributing (diversions in or out, sinkholes, karst areas, etc.)? Rainfall- Is the historical rainfall accurately portrayed throughout the entire watershed? March 2009
Typical Win-TR20 Calibration Procedure • Correct any problematic input parameters detected in Step 3. Re-run Win-TR20 to check new volume of runoff compared to gaged historical volume. Look to minor changes in the RCN to achieve a closer match. • Run steps 2-4 for a second historical event. Be sure ARC is properly set. Compare predicted volume of runoff to historic volume for this storm. March 2009
Typical Win-TR20 Calibration Procedure • Compare base RCN’s (with ARC impacts removed) for both calibrated storms. They should be close or something is wrong with another parameter in one or both of the storm event models (re-examine steps 2-4). This is a verification step. Note- Calibration problems can arise where it is advised to disregard a particular storm and evaluate another one with more reproducible results. March 2009
Typical Win-TR20 Calibration Procedure • With volumes matched it is now time to calibrate the peak discharge. Compare gaged historical peak with the predicted peak for the first storm (with volumetric calibrated and verified input parameters). Make adjustments in Tc first if necessary to calibrate peaks. If ineffective with Tc then consider the Dimensionless Unit Hydrograph. March 2009
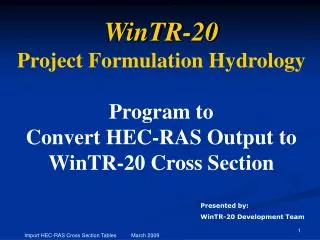
Typical Win-TR20 Calibration Procedure • If calibration is still ineffective then consider adjustments to stream reach routing parameters. This will likely involve modifying HEC-RAS runs (n-values, expansion/contraction coefficients, reach and floodplain lengths etc). Somewhere in this mix, a calibration should be achieved. Note- With volumes matching and peaks being tuned, be aware of the overall hydrograph shape and if further adjustments are needed. March 2009
Typical Win-TR20 Calibration Procedure • Run steps 6 and 7 for the second storm and compare the Win-TR20 input parameter selection between the two storms to verify peak prediction features. Note- Calibration problems can arise where it is advised to disregard a particular storm and evaluate another one with more reproducible results. Baseflow adjustment may be key. March 2009
Typical Calibration Procedure • The calibration process is now complete. The calibrated Win-TR20 input parameters offer the most reliable means of modeling the watershed for planning or design purposes. March 2009
Another Calibration Procedure… • Comparison of actual high water marks from known events with high water marks from Win-TR20 and HECRAS models. The typical situation is to have only high water marks and a “feel” for total watershed rainfall that occurred (no actual distribution). • Can prove difficult because of the many variables involved between the 2 models. Relies heavily on sound engineering judgment. March 2009
What about calibration conflicts? • They do happen. • Review procedures, check for errors. • Review target data, look for outliers. • Use professional judgment. • If a particular storm event refuses to calibrate comparably with others then drop it for another. Unknowns may be the cause. Calibration will not typically yield perfect results. Look for reasonable trends. March 2009
Isabel - 2003 March 2009
QUESTIONS??? March 2009
The End March 2009