Download
1 / 22
220 likes | 309 Views
Mobile phones – a new research challenge EMRO meeting 3 th June 2002, Crete, Greece. Knut-Arne Futsæter TNS Norsk Gallup http://www.gallup.no/medier. 1. Introduction. The major question is:

E N D
Mobile phones – a new researchchallengeEMRO meeting 3th June 2002, Crete, Greece Knut-Arne Futsæter TNS Norsk Gallup http://www.gallup.no/medier
1. Introduction The major question is: • Do people who use mobile phones only differ from other people, and will the use of media differ when the sample also includes people using mobiles only? 8This is a major challenge for the multimedia survey Consumer & Media and recruitment of the TV-meter panel, both of which are carried out on CATI with fixed telephone lines only. • In this paper I will discuss the challenge regarding people with mobiles only in general and the age group 15-35 years in particular.
The Nordic region – a test bed for media and telecom 8The Nordic region is a highly developed media and telecom marked and a test bed for new technology. Not only is Internet access high compared to other countries: 8Eighty-six per cent of the Norwegian population have mobile phones, and a growing number have mobiles only. However, this is considerably less than in Finland – the Nokia country. 8Since Finland was the first country to include mobile phones in its surveys, Norway has benefited greatly from following the trends and survey results in Finland. The empirical results from Norway also share a number of things in common with those shown to us by Lena Sandell at last year’s EMRO conference.
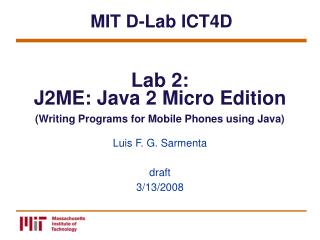
10% have mobiles only 10% 76% 14% Source: Norwegian Telecom Index (NTI) February 2002.
Internet access and use in Norway 8The high percentage of those with both fixed line and mobile phones can be partly explained by the powerful growth in Internet use. • During the past year both access to, and use of, the Internet have continued to grow rapidly in Norway. • In the first quarter of 2002, 71% were connected to the Internet and 66% had Internet access at home. Source: Consumer & Media. Gallups InterTrack. All persons aged 13 and more.
Internet drives the number of telephone lines • Because of the interest in obtaining Internet access at home, more and more people are subscribing to multiple phone lines. • 66% have Internet access at home. • Among those, 10% have broadband and 51% ISDN. • This means that approximately 6 out of 10 who have access to the Internet also have access to two or more phone lines at home.
The red bars show the percentage of those with mobiles only, the blue bars those with fixed line phones only and the yellow those with both. Here we see that the percentage of those with mobiles only is greatest among men, the age group 15-25 and those with a lower education. Age is shown to be the strongest variable. Use of the Internet in Norway (1): Access to the Internet 22% of the age group 15-24 have mobiles only! Source: Nordic Telecom Index 1,070 nationalCATI interviews February 2002. 7
2. Method: Inclusion of mobile phones in telephone surveys • The inclusion of mobile phones in telephone surveys raises some methodology issues due to: • Sample? • Weights? • Accessibility: Is the mobile always on and does the respondent have it with him/her? And what about interview quality? • Will people show a positive attitude towards being interviewed on their mobiles? • Refusal? • What about the interview situation? • What about the questions and the length of the interview?
Changes in the telephone coverage List based sampling Frame: Telephone directory of fixed phone numbers: RDD sampling Frame: List of consecutive mobile phone numbers Primary sampling units Primary sampling units Secondary sampling units
Calculation of Survey Weights First we have to develop a basis weight: • Adjust for multiple phone lines. • Create on the basis of number of phone lines (fixed and mobile) Then we adjust the sample to the target population: • Age • Gender • Geography • Household size
3. Results from ”Ung & Urban” • I March 2002 a survey was conducted among 15-35-year-olds in Norway’s five largest cities. In many ways it can be regarded as a mini-“F&M” (the multimedia survey: Consumer and Media). • The first part consisted of telephone interviews with 2,000 persons, 400 of whom had mobiles only. The average interview time was 11 minutes and the interviewing went very well. • Then we mailed them a questionnaire about their attitudes, opinions, behaviour, etc. The questionnaire form also contained a diary in which the respondent was to enter his or her whereabouts, activity and media use during the course of a normal day – i.e. a time-budget study based on the same template as presented at the EMRO meeting in 1999.
21% of the age group 15-35 living in the five largest cities in Norway can only be reached by mobile. Those with the following characteristics are especially difficult to reach by fixed phone lines only: 4Men 4Aged 20-24 years 4Living alone 4Income below NOK 200,000 4Only secondary education 4Vote for the populist party, Frp. 4Unmarried Use of the Internet in Norway (1): Access to the Internet Who have mobiles only among the young and urban population? Percentage Source: Ung & Urban 2002 1,990 CATI interviews Mars 2002 among the age group 15-35 year living in the five largest cities. 12
Location on weekdays:Those with mobiles only spend more time outside the home • The graph shows that those with mobiles only spend 741 minutes outside the home, while the average for all is 769 minutes. • Those with mobiles only spend more time in their car and other places, i.e. outside the home, than those with fixed lines. Minutes Source: Ung & Urban 2002 1,990 CATI interviews Mars 2002 among the age group 15-35 year living in the five largest cities.
Time spent on media:More radio and less Internet • The graph shows that those with mobiles only spend 228 minutes watching TV, while the average for all is 205 minutes. • Furthermore, we see that those with mobiles only spend more time listening to the radio and reading magazines than those with fixed line phones. On the other hand, they spend less time on newspapers and the Internet. • This coincides well with the sociodemographic profile of those with mobiles only (see picture 12). Minutes Source: Ung & Urban 2002 1,990 CATI interviews Mars 2002 among the age group 15-35 year living in the five largest cities.
The indexes are calculated by applying the frequency question among those who have mobiles only as compared to the total. The green bars show that those with mobiles only read more frequently the two major nonsubscription newspapers, VG and Dagbladet as well as free newspapers. The yellow bars, on the other hand, show they read less often other national and regional newspapers. Looking at all the newspapers collectively, we see that those with mobiles only read newspapers less frequently than those with fixed line phones. Use of the Internet in Norway (1): Access to the Internet Newspapers:Different reading habits Percentage Source: Ung & Urban 2002 1,990 CATI interviews Mars 2002 among the age group 15-35 year living in the five largest cities. 15
The green bars show that those with mobiles only read more frequently various types of magazines, particularly automotive, sports, lifestyle magazines, etc. The yellow bars show that they read less frequently magazines for young women and computer magazines. Overall, those with mobiles only read magazines more frequently than those with fixed line phones. The indexes are calculated by applying the frequency question among those with mobiles only as compared to the total. Use of the Internet in Norway (1): Access to the Internet Magazines:Different reading habits Percentage Source: Ung & Urban 2002 1,990 CATI interviews Mars 2002 among the age group 15-35 year living in the five largest cities. 16
Those with mobiles only are less likely to have a TV at home, and if they have a TV, it is more often with just an ordinary antenna and a limited channel offering. They are less likely to have cable or a satellite dish, and they are slower to obtain digital tuner equipment. Use of the Internet in Norway (1): Access to the Internet TV equipments:Less access to many TV channels Percentage Source: Ung & Urban 2002 1,990 CATI interviews Mars 2002 among the age group 15-35 year living in the five largest cities. 17
In all, those with mobiles only watch more frequently foreign TV channels, in spite of the fact that this group generally has access to fewer channels than those with fixed line phones. On the other hand, they watch less frequently some of the Norwegian channels. In all, those with mobiles only have relatively the same viewing habits as those with fixed line phones. The indexes are calculated by applying the frequency question among those with mobiles only as compared to the total. Use of the Internet in Norway (1): Access to the Internet TV-viewing:Minor differences Percentage Source: Ung & Urban 2002 1,990 CATI interviews Mars 2002 among the age group 15-35 year living in the five largest cities. 18
Those with mobiles only listen more often to NRK’s youth channels than those with fixed line phones. On the other hand, they listen less often to NRK’s main channel, P1, and its culture channel, P2. The indexes are calculated by applying the frequency question among those with mobiles only as compared to the total. Use of the Internet in Norway (1): Access to the Internet Radio:Different listening preferences Percentage Source: Ung & Urban 2002 1,990 CATI interviews Mars 2002 among the age group 15-35 year living in the five largest cities. 19
Those with mobiles only generally have less Internet access, especially in their home. Their daily Internet use is also 16 percentage points less than the average. Use of the Internet in Norway (1): Access to the Internet Internet:Much less access Percentage Source: Ung & Urban 2002 1,990 CATI interviews Mars 2002 among the age group 15-35 year living in the five largest cities. 20
4. Conclusion and some implications (1) We have seen that those who only have mobile phones are overrepresented in some demographic groups. Furthermore, those in the age group 15-35 years with mobiles only have different media habits: 8They spend particularly more time listening to the radio and less time on the Internet. 8They read different newspapers and magazines and listen to different radio stations than do those with fixed line phones.
4. Conclusion and some implications (2) • The results show that the time is soon ripe for implementing a limited-sample interview via mobile phone in our media surveys. This must be done in several phases as it becomes increasingly reliable. • Moreover, we must discuss implementing interviews via mobile with our customers, especially in view of how much the inclusion of mobile samples will increase the cost of collecting data. • Implementing mobile samples also opens the possibility for other types of surveys previously rendered difficult because they were methodologically and economically unfeasible. As an example, Norsk Gallup will this summer conduct a survey of media use when people are on holiday.