Download
1 / 18
180 likes | 311 Views
Roosevelt Energy. Roosevelt Institution University of Wisconsin-Madison October 19, 2007. John Dunlop American Wind Energy Association. Who is AWEA ?. American Wind Energy Association Established 1974 www.awea.org National Trade Association for Wind Industry Legislative / Lobbying

E N D
Roosevelt Energy Roosevelt Institution University of Wisconsin-MadisonOctober 19, 2007 John Dunlop American Wind Energy Association
Who is AWEA ? • American Wind Energy Association • Established 1974 • www.awea.org • National Trade Association for Wind Industry • Legislative / Lobbying • Education & Outreach • Member Services • Currently 1100 business, utility, academic, and non-profit members
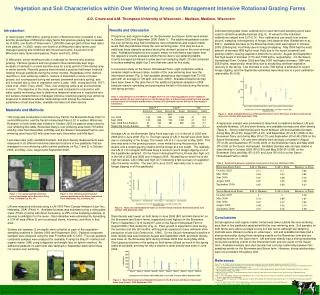
Wind Growing Worldwide 1. Germany: 20,622 MW 2. Spain: 11,615 MW 3. U.S.: 11,603 MW 4. India: 6,270 MW 5. Denmark: 3,136 MW As of December 31, 2006 Source: AWEA Global Market Report
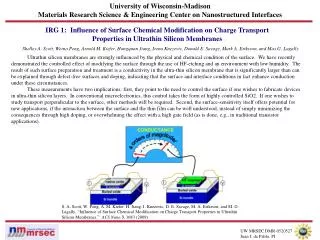
Reduced Cost Driving Wind’s Success 38 cents/kWh 4 - 7 cents/kWh Levelized cost at good wind sites in nominal dollars, including production tax credit
MN: 25% by 2025 (Xcel: 30% by 2020) ME: 30% by 2000 10% by 2017 - new RE VT: RE meets load growth by 2012 *WA: 15% by 2020 ND: 10% by 2015 • NH: 23.8% in 2025 WI: requirement varies by utility; 10% by 2015 goal MA: 4% by 2009 + 1% annual increase MT: 15% by 2015 RI: 16% by 2020 CT: 23% by 2020 • *NV: 20% by 2015 IA: 105 MW • NY: 24% by 2013 • CO: 20% by 2020(IOUs) *10% by 2020 (co-ops & large munis) IL: 25% by 2025 • NJ: 22.5% by 2021 CA: 20% by 2010 • PA: 18%¹ by 2020 MO: 11% by 2020 • MD: 9.5% in 2022 • NC: 12.5% by 2021(IOUs) 10% by 2018 (co-ops & munis) • AZ: 15% by 2025 • *DE: 20% by 2019 • DC: 11% by 2022 • NM: 20% by 2020(IOUs) • 10% by 2020 (co-ops) *VA: 12% by 2022 TX: 5,880 MW by 2015 State RES HI: 20% by 2020 State Goal Solar water heating eligible State RES Requirements OR: 25% by 2025(large utilities) 5% - 10% by 2025 (smaller utilities)
Washington 818 Montana 146 North Dakota 178 ME 42 Minnesota 895 Oregon 438 VT 6 Idaho 75 NH 1 South Dakota 44 Wisconsin 53 New York 370 MA 4 Wyoming 288 Michigan 3 Nebraska 20 Rhode Island 1 Pennsylvania 179 Iowa 931 Nebraska 73 Ohio 7 New Jersey 8 Utah 1 Illinois 107 Colorado 291 WV 66 Kansas 364 California 2376 Tennessee 29 Oklahoma 595 New Mexico 496 > 1,000 MW 100 MW-1,000 MW < 100 MW Texas 2749 Wind farm currently under construction (not necessarily comprehensive) Alaska 2 Hawaii 63 U.S. Wind Power Installations Total: 12,634 MW as of 06/30/07
US Wind 20% Scenario 2006 State of the Union Address “…We will invest more in … revolutionary and…wind technologies” Advanced Energy Initiative “Areas with good wind resources have the potential to supply up to 20% of the electricity consumption of the United States.”
What does 20% wind look like? • Would require a total of 305 GW installed by 2030. • Compared to the 14 GW that will be installed by end of 2007.
National Results: 20% Wind in 2030 • Over half trillion dollars investment in wind • Just $43 billion for 20% wind over no-wind scenario • $128 billion in reduced natural gas prices from reduced demand (11% reduction in demand) • Nearly 180,000 jobs direct (+120,000 indirect) in 2030 • Saves 4 trillion gallons of water use (8%) • 825 million tons of CO2 avoided in 2030 Monetary values in present values, discounted at 7% per OMB guidance
Contact AWEA www.AWEA.org 202.383.2500 JDunlop@AWEA.org 612.377.3270