Download
1 / 8
80 likes | 150 Views
Fujiwhara – Binary (TC to TC) interaction. Happens on average more than once a year in NW PAC, every 3 years in Atlantic Distance of mutual influence depends on size of TCs, but 1300-1400 km (700-750 nmi) seems to be critical distance

E N D
Fujiwhara – Binary (TC to TC) interaction • Happens on average more than once a year in NW PAC, every 3 years in Atlantic • Distance of mutual influence depends on size of TCs, but 1300-1400 km (700-750 nmi) seems to be critical distance • Orbit around a centroid, cyclonically, orbital speed inversely related to separation distance
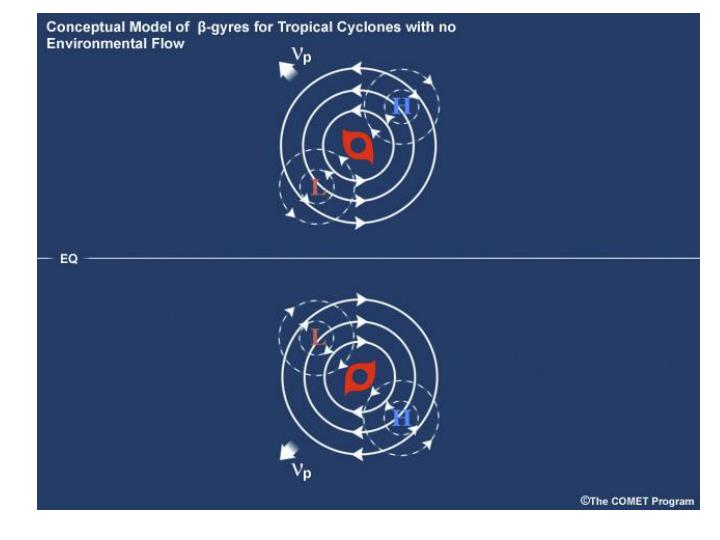
Track Forecasting • All of the motion effects together add up to resultant motion • Steering • β-effect, environmental vorticity, Fujiwhara • Shear • Size/Strength
Models • Extrapolation (XTRP) – simply continuing past 12 hour motion • Simplified Dynamical Track Models • Beta and Advection (BAMD, BAMM, BAMS) • The Global Models • GFS, NOGAPS, UKMET, ECMWF • Regional (GFDL, GFDN, HWRF) • Customized for TC forecasting • Limited by domain size and time range • Nested • Sometimes accurately forecast intensity changes • Statistical • Track: CLIPER (climatology and persistence) • Intensity: SHIPS • Uses environment parameters from, e.g., GFS • Ensembles and Consensus
Model Spaghetti(Includes Consensus Models) Current Link
The Cone • Historical data indicate that the entire 5-day path of the center of the tropical cyclone will remain within the cone about 60-70% of the time. • How the NHC gets the cone: To form the cone, a set of imaginary circles are placed along the forecast track at the 12, 24, 36, 48, 72, 96, and 120 h positions, where the size of each circle is set so that it encloses 67% of the previous five years official forecast errors. • The cone is then formed by smoothly connecting the area swept out by the set of circles. • And yet, it is still way too big most of the time.