Download
1 / 17
170 likes | 263 Views
The past, present and future of carbon on land. Bob Scholes [BScholes@csir.co.za] CSIR Div of Water, Environment and Forestry Technology South Africa. The global carbon budget, 1990-1999. From atmospheric measurements. Prentice et al 2001, IPCC TAR Ch 3 * 1 Pg = 1 billion tonnes.

E N D
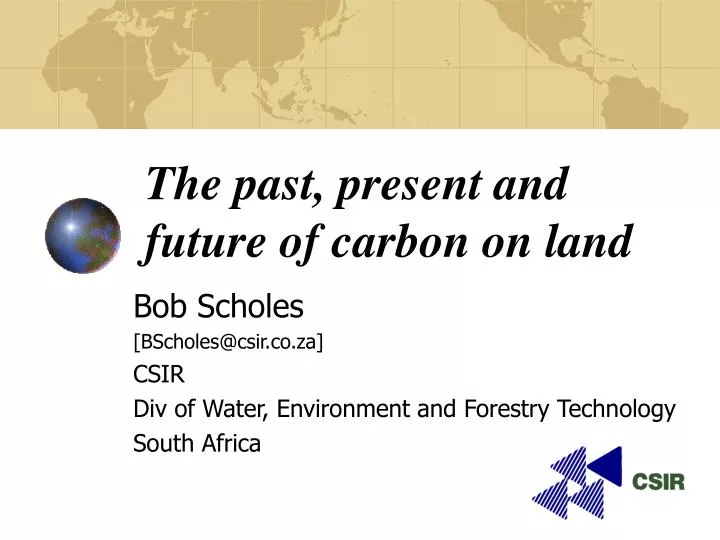
The past, present and future of carbon on land Bob Scholes [BScholes@csir.co.za] CSIR Div of Water, Environment and Forestry Technology South Africa
The global carbon budget, 1990-1999 From atmospheric measurements. Prentice et al 2001, IPCC TAR Ch 3 * 1 Pg = 1 billion tonnes
The terrestrial carbon sink helps to control the rise of atmospheric CO2 • Currently averages around 3 PgC/y • Varies between years, following climate • Globally distributed • strong in the northern hemisphere temperate region • Has grown since 1950* • Will saturate; perhaps this century *model result, measurements confirm for 1980s
Mechanisms for the land C sink:the proportional contribution by each is unknown • CO2 fertilisation • N fertilisation (from atmospheric deposition) • Regrowth of forest land cleared 1800-1940 • Differing functional response of photosynthesis and respiration to global change
H2O N P C Biogeochemical cycles mesh like cogs… …but this is only a metaphor. There is slippage. • Why do they link? • ecosystem stoichiometry • co-factors in shared • processes
The limitations of Liebig’s Law • Adaptation causes organisms in natural ecosystems to be close to limitation by severalfactors simultaneously • Factors interact such that one changes the availability of others • Limitation can alternate in time, space or process Global biogeochemical models will need to be more sophisticated in how they treat limitation
Human activity has altered all the cycles Falkowski et al 2001 Science 290, 291-296 *100 x (perturbed-natural)/natural
C,N,P and H2O in terrestrial systems CO2 Rubisco Stomata Leaf N2 Fire Allocation Wood N2O, N2 Biological N Fixation P required Decomposition Denitrification Soil water Soil Leaching
Why are African savannas nitrogen-poor? Infertile savannas and grasslands Van Wilgen & Scholes 1997 In ‘Fires in African savannas’ ch 3. Fires in Africa, May-Oct 1992 Scholes et al JGR 101, 23677
Does N deposition increase C storage? • Stoichiometry suggests that the C sink due to N deposition is 0.6+0.3 Pg/y (Hudson et al 1994 GBC 8, 307-33) • 15N data suggests that only about half of the N is incorporated in organic compounds (Nadelhoffer et al 1999 Nature 398,145-7) Most N deposition is occurring in areas approaching N saturation
Land-ocean biogeochemical link • Biological C pump is key to ocean sink • Complex limitation of ocean NPP by N, P, Fe • C sinking to deep ocean controlled by body size, which is influenced by N, Fe, Si supply • Main sources of P, Fe, Si (and indirectly, N) are on land • Land source strength is controlled by climate (wind, drought/floods, vegetation cover)
Fertilisation of the southern Indian ocean from Africa: Fe, Si, N and S Piketh, S et al 2001 South African Journal of Science, 96, 244-246.
Periodicity at 110 000 years Ceiling at 270 ppm Floor at 180 ppm Rapid rise Slow draw-down fine control Petit et al Nature 399, 439-46 What message does this signal carry?
An Earth System hypothesis • 180 ppm is the ground state. Fine control by ‘biospheric compensation point’, mainly on land • Orbital forcing triggers ocean reorganisation, releasing deep sea CO2.Amplified by other greenhouse gases and retreating ice • 250 ppm is a quasi-equilibrium, including biological storage on land • Slow release of N, P and Fe from land activates ocean biological pump, leading to draw-down of atmospheric CO2 Falkowski et al 2001 Science 290, 291-6 (integrating other sources)
The biospheric carbon compensation point Leaf compensation point ~50 ppm C assimilation Increasing scale alters the compensation Point and the saturation level [CO2] in atmosphere Whole plant compensation point ~120 ppm C assimilation [CO2] in atmosphere Biosphere compensation point ~180 ppm • [Hypothesis] • respiration • water use, nutrient supply • fire C assimilation [CO2] in atmosphere
Implications of the past Earth System behavior • Return to the pre-industrial CO2 level and climate will take millennia, and will require reduction of emissions to some small number • There is no known system attractor above 250 ppm
Where have we come from, and where are we going? • A purely physico-chemical view of the climate system is no longer defensible • Greater integration of the carbon cycle with the water, nitrogen, phosphorus and other cycles is essential • Land-ocean links involving dust and rivers are an important part of the ecological metabolism of the earth