Download

1 / 34
340 likes | 435 Views
Presentation I The Virginia Graduation and Completion Index. Each year, almost ONE-THIRD of all public high school students—1.2 million—fail to graduate with their class. That’s one student every 26 seconds.

E N D
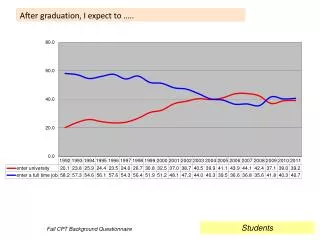
Each year, almost ONE-THIRD of all public high school students—1.2 million—fail to graduate with their class. That’s one student every 26 seconds. ABOUT HALF of African Americans, Hispanics and Native Americans in public schools fail to graduate. There are nearly 2,000 HIGH SCHOOLS with less than 50 percent graduation rates concentrated in 50 large cities and in 15 primarily southern and southwestern states. National Graduation RateTrends The Silent Epidemic: http://www.civicenterprises.net/pdfs/thesilentepidemic3-06.pdf
Students who drop-out of high school in Virginia each year have similar characteristics. • Being absent more than 20% of the time • Failing or low grades in English and mathematics • Low Standards of Learning test scores in language arts/reading or mathematics • Multiple behavior referrals and suspensions • Changing schools during the school year • Repeating the current grade • Two or more years over age for grade
Virginia Graduation Rate* • Dropouts from the class of 2008 will cost Virginia almost $7.6 billion in lost wages over their lifetime. • About $6.5 billion would be added to Virginia’s economy by 2020 if students of color graduated at the same rate as white students. • The average high school dropout in Virginia produces a lifetime net fiscal “surplus” of $17,690 more in taxes than he/she would impose in transfer costs and institutionalization costs. • For Virginia high school graduates, the surplus is $368,870, a loss of $351,180 for each dropout.** *Visions to Practice Conference, July, 2009, Mary McNaught, Chief of Staff, Civic Enterprises ** Council on Virginia’s Future, “The High Cost of Low Educational Attainment” August, 2008
Virginia High School Cohort Rate Using longitudinal information from the Education Information Management System (EIMS), the Virginia Department of Education (VDOE) was able to produce a cohort report for the Class of 2008.
Standards of Accreditation In February, 2009, the Board of Education strengthened Virginia’s accountability program by: • Requiring high schools—beginning with the 2011-2012 school year—to meet an annual benchmark for graduation. • Revising Virginia’s accreditation standards to create a graduation and completion index for high schools.
Graduation and CompletionIndex Beginning with accreditation ratings announced in fall 2011, high schools must earn a minimum of 85 points on the graduation and completion index—as well as achieve the required pass rates on state tests in English, history/social science, mathematics and science—to be Fully Accredited.
Graduation and Completion Index(cont.) • High schools that do not attain the minimum graduation benchmark, but meet all other requirements, can be Provisionally Accredited until fall 2015 by achieving interim graduation benchmarks. • High schools that achieve the required pass rates on state assessments, but do not meet the provisional benchmarks for graduation and completion, will be rated as Accredited with Warning.
Graduation and Completion Index The Graduation and CompletionIndex awards: • 100 points for students who graduate with a(n) • Advanced Studies Diploma • Standard Diploma • Modified Standard Diploma • Special Diploma or General Achievement Diploma • 75 points for students who earn a GED • 70 points for students still in school • 25 points for students who finish high school with a Certificate of Completion
Graduation and Completion Index Index Points Accreditation Status In 2016-2017, all schools must have a Graduation and Completion Index of 85 and meet the standards in the four academic areas to be Fully Accredited. Any high school with index point totals less than 85 or below the standards in any of the academic areas will be Accredited with Warning.
Happy Hills High School Met the SOL Assessment Benchmarks in all content areas Met Graduation and Completion Index Accreditation Rating: FULLY ACCREDITED
Satchel Paige High School Met the SOL Assessment Benchmarks in all content areas Met the Provisional Benchmark for the Graduation and Completion Index Accreditation Rating: Provisionally Accredited – Graduation and Completion Index
Sugar County High School Met the SOL Assessment Benchmarks in all content areas Did not meet the Provisional Benchmark for the Graduation and Completion Index Accreditation Rating: Accredited with Warning – Graduation and Completion Index
Virginia Early Warning System (VEWS) Tool • Virginia has developed a research-based Early Warning System Tool (VEWS) in collaboration with the Appalachia Regional Comprehensive Center at Edvantia and the National High School Center which was piloted in four school divisions • Indicators addressing attendance, behavior, and academic performance identify students at risk of dropping out of high school
Available data housed at the school that are good predictors of whether a student is likely to drop out of school Divisions and schools can use this information to: Track the risk factors associated with dropout behaviors for individual students Implement tiered interventions that support off-track students while they are still in school – before they drop out Look for patterns and identify school climate issues that may contribute to disproportionate dropout rates at a subset of high schools or within subpopulations of students Virginia Early Warning System (VEWS) Tool
Early Warning Systems Early warning systems (EWS) rely on readily available data housed at the school to: • Predict which students are at-risk for dropping out of high school • Target resources to support off-track students while they are still in school, before they drop out • Examine patterns and identify school climate issues
9th Grade is a Critical Year • Ninth grade is a “make or break year” • More students fail 9th grade than any other high school grade • A disproportionate number of students who are held back in 9th grade subsequently drop out • Monitoring students’ progress throughout 9th grade—and even during the first semester—provides powerful indicators that can predict whether students will complete high school: • Engagement • Course performance • Chicago’s “On-Track” Indicator (CCSR End-of-Year)
Virginia Early Warning System (VEWS) Pilot Team A team of school divisions, education organizations, and VDOE consultants assisted the VDOE with the pilot of the VEWS Tool • School divisions: Franklin City, Lee County, Richmond City, and Pulaski County • Organizations: Appalachia Regional Comprehensive Center and the National High School Center • Validation of the Virginia Pre-High School Index • Development of an implementation guide based on the pilot divisions’ experience • Refinement of the VEWS Tool based on pilot divisions’ feedback and VDOE suggestions
VEWS Tool Features Based on this work over the past two years, the National High School Center in collaboration with ARCC and VDOE conceptualized the current VEWS Tool. This version allows users to: • Import data • Accommodate local contextual factors for high schools (e.g., semesters vs. trimesters vs. quarters) • Align with the Virginia pre-high school index • Modify the benchmarks/thresholds based on analysis of longitudinal data (i.e., indicator validation) • Integrate behavioral indicators (referrals and suspensions)
VEWS Tool Features Features, continued: • House an inventory of dropout prevention interventions • Assign students to intervention programs and monitor student response and progress in the interventions over the course of the school year • Create pre-set school-level summary reports, detailed student-level reports, and individual student reports • Create customized student-level reports
Step One: Establish Roles and Responsibilities • VEWS teams need to include individuals who have: • Authority to make decisions • Knowledge of diverse students • Expertise to manage and analyze data • VEWS team are required to: • Meet regularly • Communicate EWS/dropout prevention issues to groups/individuals outside of the team • Solicit feedback from stakeholders (leaders, staff, students, parents) • Monitor students’ progress
Step Two: Use the VEWS Tool • In order to be used as an effective tool to support VEWS team work: • Data must be regularly entered/imported throughout the school year • At least one individual should be responsible for ensuring the VEWS tool is loaded with the latest data • VEWS Team members must be trained to understand the use of the tool • Reports must be used to make decisions about students • Students must be assigned to interventions and progress monitored
Step Three: Review VEWS Data • VEWS data are reviewed and monitored to identify students at risk for dropping out and to understand patterns in student engagement and academic performance • Questions to ask about VEWS data: • Student-level patterns: What do your data tell you about individual students who are at-risk? • School-level patterns: What do your data tell you about how the school is doing? • Are students who were flagged from the beginning remaining “off-track” through the year? • Are students who were flagged at one reporting period back “on-track” at the next?
Step Four: Interpret VEWS Data • The VEWS team must look BEYOND the indicators and dig deeper into reasons for student disengagement with school and academic failure • Indicators are just observable symptoms, not root causes • It is important to examine additional data from a variety of sources not included in the tool (e.g., talking to classroom teachers, parents, individual students, other adults in the school) • Looking at data beyond those in the VEWS Tool can help identify individual and common needs among groups of students and raise new questions for understanding students’ reasons for being off-track for graduation
Step Five: Assign and Provide Interventions • The VEWS team matches individual students to specific interventions after having gathered information about: • Potential root causes for individual flagged students • The available dropout prevention and academic and behavioral support programs in the school, district, and community • A tiered approach can be used to match students to interventions based on their individual needs
Step Six: Monitor Students and Interventions • The VEWS team monitors students who are participating in interventions to: • Make necessary midcourse corrections by identifying students whose needs are not being met • Identify new interventions that will meet students’ needs • Use data to monitor the effectiveness of interventions offered • Increase knowledge about the general effectiveness of interventions • Improve the matching of students to interventions • Communicate with families and appropriate stakeholders and solicit their involvement in the monitoring process
Step Seven: Evaluate and Refine the VEWS Process • Refine the VEWS Implementation Process • During the school year • At the end of a school year • Identify short- and long-term needs and solutions • Student needs • Organizational needs (school and/or division)
VEWS Demonstration http://www.doe.virginia.gov/support/school_improvement/early_warning_system/index.shtml
The Virginia Early Warning System (VEWS) Tool is available on the Office of School Improvement’s Web site.
Contact Information Dr. Yvonne A. Holloman Division Level Support Coordinator Office of School Improvement 804-225-2064 Yvonne.holloman@doe.virginia.gov Dr. Susan FitzPatrick Grants and Reports Manager Office of School Improvement 804-225-2897 Susan.fitzpatrick@doe.virginia.gov