Download
1 / 11

E N D
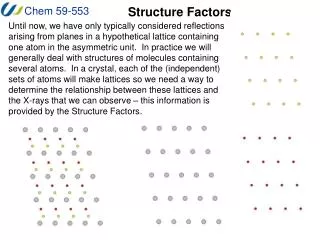
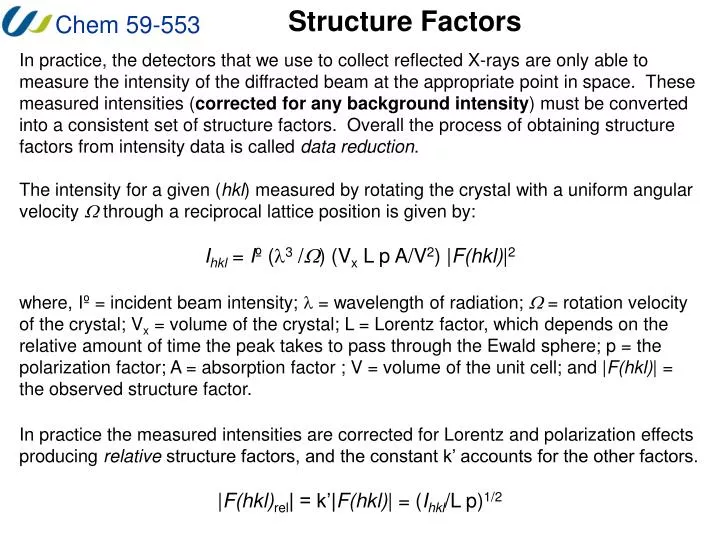
Structure Factors In practice, the detectors that we use to collect reflected X-rays are only able to measure the intensity of the diffracted beam at the appropriate point in space. These measured intensities (corrected for any background intensity) must be converted into a consistent set of structure factors. Overall the process of obtaining structure factors from intensity data is called data reduction. The intensity for a given (hkl) measured by rotating the crystal with a uniform angular velocity W through a reciprocal lattice position is given by: Ihkl = Iº (l3 /W) (Vx L p A/V2) |F(hkl)|2 where, Iº = incident beam intensity; l = wavelength of radiation; W = rotation velocity of the crystal; Vx = volume of the crystal; L = Lorentz factor, which depends on the relative amount of time the peak takes to pass through the Ewald sphere; p = the polarization factor; A = absorption factor ; V = volume of the unit cell; and |F(hkl)| = the observed structure factor. In practice the measured intensities are corrected for Lorentz and polarization effects producing relative structure factors, and the constant k’ accounts for the other factors. |F(hkl)rel| = k’|F(hkl)| = (Ihkl/L p)1/2
Lorentz and Polarization As a crystal is rotated, the reciprocal lattice rotates and diffraction occurs when an RL point passes through the Ewald sphere. For geometric reasons, some of the RL points will spend longer on the surface of the Ewald sphere than others (confirm this with XrayView), which would distort the actual distribution of intensities. The Lorentz correction that is applied to each reflection scales the intensities to account for this – each reflection is scaled such that the time on the Ewald sphere is identical. L = 1/(2sinq) The partial polarization of the X-rays that are diffracted from the planes in the crystal reduces the intensity of reflected beam. The effect also depends only on the diffraction angle and is accounted for by the correction factor: p = (1+ cos2(2q))/2 X-rays with electric vectors parallel to the plane scatter with no loss in intensity, those with electric vectors perpendicular to the plane have an angular dependence.
Absorption X-rays are also absorbed by the materials through which they pass. There are several ways in which this happens and these are accounted for by one or more of the methods described below. Primary Extinction: only in “perfect” crystals – we do not encounter this. Secondary Extinction: too many X-rays reflect off the first plane in the crystal and do not penetrate into the crystal. This is also not usually a major problem The mosaic nature of real crystals reduces primary and secondary extinction – it also spreads out the q value for each reflection.
Absorption The absorption effects that we have to take into account are attributable to the inelastic interaction of the X-rays with the atoms in the crystal. This absorbtion is related to the path length (t) the X-rays travel through the material and the nature of the atoms in the crystal as expressed by the absorption coefficient m. Ihkl= Iºexp(-mt) m = r[a/100(ma/r) + b/100(mb/r) +…….] where ma/r is mass absorption coefficient for atom a and a/100 is the percentage composition of that atom in the material. For crystals containing only light (2nd row) atoms, m is usually < 10 cm-1 and does not cause major problems, however for crystals containing heavier atoms, m > 10 cm-1 and can significantly affect the data. Note that since the path length will make a difference, plate-shaped and needle shaped crystals cause problems because the path lengths through a crystal will be very different for the different (hkl) values. The ideal shape for a crystal would thus be spherical.
Absorption Absorption may be corrected by any of several methods. These include both empirical and analytical methods. Empirical corrections: 1. based on Psi Scan data. approximates crystal absorption profile by measuring Ihkl as a function of rotation of crystal 2. SADABS: mathematical fit of data – this is what we generally use for data collected with an area detector (it is also known as a multi-scan method). Analytical corrections: Use geometry to determine the path lenghts: By assigning the Miller indices of the faces of the crystal and accurately measuring the dimensions of the crystal, one can calculate the length of the crystal through which the beam passes for each Ihkl. In practice, a slightly simplified model of the crystal is generally used. There are numerous other methods that have been used.
Structure Factors Note that all of the measured intensities must be put onto the same scale – this is the process of data reduction. During data reduction, all of the collected reflections are merged (each reflection is collected several times when an area detector is used) to form a single set of structure factor data that is scaled to allow for comparison of the intensities. The quality of the data after merging can be estimated by one of several reliability factors (R factors) Rint = S|Fo2 - Fo2(mean)| / S[ Fo2 ] (this is also sometimes called Rsymm or Rmerge) Rsigma = S[ s(Fo2) ] / S[ Fo2 ] Where, s is the appropriate standard deviation, and Fo is the “observed” (i.e. experimental – note that F implies F(hkl)) structure factor and the summations are taken for all values of (hkl). In general, the closer these values are to 0, the better the data. The Rint value provides a measure of the consistency of intensity measurements for symmetry related (hkl) values (and multiple measurements of the same (hkl) values). Similarly, the Rsigma values tell us about the accuracy of the data and the data reduction process. If either of these values is much greater than around 0.1 (10%), the data might not be suitable for solution and refinement.
Data Collection Below is a summary of the data collection and reduction process with the software we use: Mount and center crystal (done optically) Collect initial reflections (SMART) Determine Unit Cell and Orientation Matrix (SMART) Select appropriate portion of limiting sphere to collect (SMART) Collect Data (SMART) Initial Data Reduction (SAINT) Final Data Reduction and Absorption Correction (SADABS)
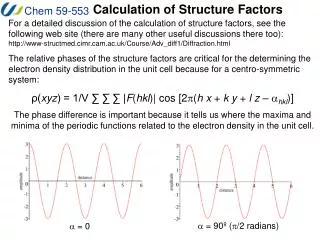
Fourier Transformations, Structure Factors and Electron Density The structure factors are the Fourier Transform (FT) of the electron density r(xyz) and the electron density is the reverse Fourier Transform (FT-1)of the structure factors. A Fourier Transform allows a function to be represented in terms of a series of sine and/or cosine waves. Because of the periodicity of sinusoidal waves, such functions are particularly well-suited to model other periodic functions (such as the electron density in a lattice). The waves that we may use in the case of X-ray diffraction are the structure factors and the function that we wish to model is the electron density. The figure to the right shows the addition of a constant and 3 cosine waves to model a square-wave function. Consider why only cosines are used.
Fourier Transformations, Structure Factors and Electron Density The structure factors are the Fourier Transform (FT) of the electron density r(xyz) and the electron density is the reverse Fourier Transform (FT-1)of the structure factors. F(hkl) = ∑jfj exp[2pi (h xj + k yj + l zj)] Diffracted Wave Resultant Sum Scattering Position/Relative Phase r(xyz) = 1/V ∑h ∑k ∑lF(hkl) exp[-2pi(h x + k y + l z)] r(xyz) = 1/V ∑h ∑k ∑l |F(hkl)| exp[-2pia(hkl)] exp[-2pi(h x + k y + l z)] Amplitude Electron Density Position/Relative Phase Intrinsic Phase Resultant Sum Note that 1/V is necessary to determine the density because F(hkl) is in units of electrons.
Fourier Transformations, Structure Factors and Electron Density If we know the positions of the electrons in the unit cell, these can easily be transformed into structure factors using this equation: F(hkl) = ∑jfj exp[2pi (h xj + k yj + l zj)] However, the reverse FT process is more difficult because we don’t have any information about the relative phases of the structure factors: r(xyz) = 1/V ∑h ∑k ∑l |F(hkl)| exp[-2pia(hkl)] exp[-2pi(h x + k y + l z)] Intrinsic Phase Position/Relative Phase This is THE problem in X-ray crystallography and it is known as the Phase Problem. To be able to determine the electron density in a crystal from the observed structure factors, we must be able to figure out the relative phases of each of the structure factors.
Structure Solution and the Phase Problem To determine the electron density of the crystal, we must determine the relative phases of each of the reflections. Attempting to systematically (or randomly) assign relative phase values for each of the structure factors is, for all intents and purposes, impossible! Any method, such as the chemical intuition, density requirements etc. that provides information about the location of the atoms in the unit cell can provide an reasonable starting point (or in some cases a complete solution). It is important to realize that if we can assign phases for some of the more intense reflections (which is equivalent to assigning important amounts of electron density to positions in the unit cell), it becomes easier to determine the rest of the phases, as we shall see when we consider refinement of a structure. In general, there are two methods that we use to obtain information about the initial information about the phases of the structure factors. These are: Patterson Methods – ignore the phase problem Direct Methods – statistical methods and reasonable assumptions