Download
1 / 39
390 likes | 528 Views
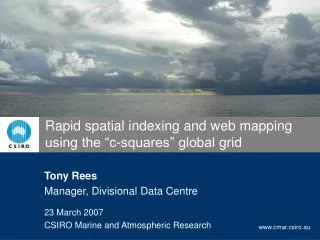
Rapid spatial indexing and web mapping using the “c-squares†global grid. Tony Rees Manager, Divisional Data Centre 23 March 2007 CSIRO Marine and Atmospheric Research. Introduction.

E N D
Rapid spatial indexing and web mapping using the “c-squares” global grid Tony Rees Manager, Divisional Data Centre 23 March 2007 CSIRO Marine and Atmospheric Research
Introduction • Web mapping – here considered to be dynamic map generation and return in response to an internet request (OGC-compliant requests and responses are a subset of these) • Slightly different / extended concept – web plotting of user-supplied data – subject of this talk • Data may be supplied by human user, or (more typically) a client application, over the web for real-time plotting • Example to be discussed is the “c-squares mapper” – developed at CMAR and in use for last 5+ years • “C-squares” are units of spatial indexing – data format used as mapper input (however, underlying mechanics may be hidden from the human user).
Example usage – CMAR “CAAB” databasehttp://www.cmar.csiro.au/caab/
Example usage – CMAR “CAAB” databasehttp://www.cmar.csiro.au/caab/
Behind the scenes – set of c-square codes: • Each c-square code is a global grid cell identifier.
Regional and Global grids • Regional grid example: British Isles… • 3 problems for large scale use: • (1) Grid does not align with lat-lon graticule
Regional and Global grids • Regional grid example: British Isles… • 3 problems for large scale use: • (1) Grid does not align with lat-lon graticule • (2) No single grid covers whole target area – problems where grids meet • (3) Some outlying portions have no grid coverage at all (e.g. Channel Is.)
Regional and Global grids • Global grids better, e.g. WMO 10 x 10 deg. squares:
Regional and Global grids • In our region:
The “c-squares” global grid • C-squares = “Concise Spatial Query and Representation System” – now 5 years old (initial code, mapper written Jan ’02) • Creates hierarchical subdivisions of WMO 10 x 10 deg. squares, e.g. • 3414= 10 deg. square • 3414:1= 5 deg. square within square 3414 • 3414:104= 1 deg. square within square 3414:1 • 3414:104:3= 0.5 deg. square within square 3414:104 • (etc., etc.) • Note the “telephone number” analogy, i.e. country => area => sub-area => sub-sub-area etc.
The “c-squares” global grid • Example squares + IDs • 3414:227:209(0.1 deg. square) • 3414:227:2(0.5 deg. square) • 3414:227(1 deg. square)
Spatial indexing using c-squares • Sample uses: • Multi-point data set(NB, can be 1 - many points in a square)
Spatial indexing using c-squares • Sample uses: • Predicted marine species range (~= polygon)
Spatial indexing using c-squares • Sample uses: • Gridded data (density per cell)
The c-squares mapper • Example code (as HTML page): - a few of many options shown • <html> • <body> • <form action = "http://www.obis.org.au/cgi-bin/cs_map.pl" method = "POST" /> • <input type = "hidden" name = "csq" value = "3414:100:1|3414:100:2|3414:100:3" /> • <input type = "hidden" name = "color" value = "FF0000" /> • <input type = "hidden" name = "fill" value = "Y" /> • <input type = "hidden" name = "map" value = "" /> • <input type = "submit" name = "submit" value = "Get map..." /> • </form> • </body • </html> • Websites to see examples: • CAAB – http://www.cmar.csiro.au/caab/ • MarLIN – http://www.cmar.csiro.au/marlin/ • AquaMaps – http://www.aquamaps.org/ • OBIS – http://www.iobis.org/
The c-squares mapper • Example code (as HTML page): - a few of many options shown • <html> • <body> • <form action = "http://www.obis.org.au/cgi-bin/cs_map.pl" method = "POST" /> • <input type = "hidden" name = "csq" value = "3414:100:1|3414:100:2|3414:100:3" /> • <input type = "hidden" name = "color" value = "FF0000" /> • <input type = "hidden" name = "fill" value = "Y" /> • <input type = "hidden" name = "map" value = "" /> • <input type = "submit" name = "submit" value = "Get map..." /> • </form> • </body • </html> • Websites to see examples: • CAAB – http://www.cmar.csiro.au/caab/ • MarLIN – http://www.cmar.csiro.au/marlin/ • AquaMaps – http://www.aquamaps.org/ • OBIS – http://www.iobis.org/
The c-squares mapper • Example code (as HTML page): - a few of many options shown • <html> • <body> • <form action = "http://www.obis.org.au/cgi-bin/cs_map.pl" method = "POST" /> • <input type = "hidden" name = "csq" value = "3414:100:1|3414:100:2|3414:100:3" /> • <input type = "hidden" name = "color" value = "FF0000" /> • <input type = "hidden" name = "fill" value = "Y" /> • <input type = "hidden" name = "map" value = "" /> • <input type = "submit" name = "submit" value = "Get map..." /> • </form> • </body • </html> • Websites to see examples: • CAAB – http://www.cmar.csiro.au/caab/ • MarLIN – http://www.cmar.csiro.au/marlin/ • AquaMaps – http://www.aquamaps.org/ • OBIS – http://www.iobis.org/
Sample usage • MarLIN – metadata catalogue for CSIRO Marine and Atmospheric Research – www.cmar.csiro.au/marlin/ • Behind the scenes…
Sample usage • AquaMaps – predicted marine species distributions – www.aquamaps.org
Sample usage • OBIS – Ocean Biogeographic Information System – www.iobis.org/ OBIS data – “all vertebrates” (6 million records, 41,000 squares) ... plotting time 16 / 25 secs (std. vs. large size map)
Sample usage OBIS species page – “wandering albatross”
Sample usage OBIS data – “wandering albatross” (970 records, 530 squares) ...
Sample usage • Current max. zoom(from “globe views”)
Sample usage • Some plotting times compared (Duke University Geospatial Lab, unpubl, Mar 2006, plus present data) • * - present data (not in Duke Univ. study). Longer times are for “large world” base maps. • NB, new CSQ mapper “globe views” take only 2-3 secs each time after initial map generation
Sample usage • Some plotting times compared (Duke University Geospatial Lab, unpubl, Mar 2006, plus present data) • * - present data (not in Duke Univ. study). Longer times are for “large world” base maps. • NB, new CSQ mapper “globe views” take only 2-3 secs each time after initial map generation
Sample usage • Some plotting times compared (Duke University Geospatial Lab, unpubl, Mar 2006, plus present data) • * - present data (not in Duke Univ. study). Longer times are for “large world” base maps. • NB, new CSQ mapper “globe views” take only 2-3 secs each time after initial map generation
Sample usage • Some plotting times compared (Duke University Geospatial Lab, unpubl, Mar 2006, plus present data) • * - present data (not in Duke Univ. study). Longer times are for “large world” base maps. • NB, new CSQ mapper “globe views” take only 2-3 secs each time after initial map generation
Sample usage • Some plotting times compared (Duke University Geospatial Lab, unpubl, Mar 2006, plus present data) • * - present data (not in Duke Univ. study). Longer times are for “large world” base maps. • NB, new CSQ mapper “globe views” take only 2-3 secs each time after initial map generation • ** c-squares mapper can plot millions of points in practice after data reduction (e.g. OBIS “vertebrates” example: 6 m records / 41,000 squares / 25 secs or less to plot)
Some future gazing… • SWOT Analysis – strengths, weaknesses, opportunities, threats? • STRENGTHS • Low / no cost solution for basic spatial indexing and search, and “entry-level” web mapping • Easy to install in non-GIS enabled systems (e.g. metadata catalogues, text documents, standard databases) • Good fit with grid-based data, multi-point data • Good for data reduction (e.g. many points, fewer squares) • No date line problems, also OK with polar data (although indexing is least efficient at poles) • Remote mapper, no dedicated client-side software, plugins, etc. needed (cf. Google Earth, desktop GIS)
Some future gazing… • SWOT Analysis – strengths, weaknesses, opportunities, threats? • WEAKNESSES • “Jaggies” when representing curves, polylines, polygons • Large regions require a lot of squares to be processed (slower mapping) • Spatial queries are approximations (2 features may share the same square, but not quite intersect) • Squares are not equal-area (latter may be preferred for some purposes) • Mapper not as fully featured as true web mapping solution; limited zoom, mostly medium / large scale physical backdrops at this time • No current integration with OGC standards
Some future gazing… • SWOT Analysis – strengths, weaknesses, opportunities, threats? • THREATS • True GIS offers more features / precision, may be needed by many users – if not now, eventually • Other remote web data plotting solutions have arrived since 2002 (some with more features, better zoom/pan, etc.) • Google Earth offers great functionality, becoming a “de facto” standard for some types of data presentation • Mapper development is resources-limited, may lead to being outclassed eventually
Some future gazing… • SWOT Analysis – strengths, weaknesses, opportunities, threats? • OPPORTUNITIES • Further development of c-squares mapper (including open source community, remote installation administrators) • Additional mapper installations around the world coming on line (today AUS + GER + SWE; USA soon) • OBIS and other “power users” are providing useful exposure and load testing for the system, also user feedback e.g. desired features • May be possible to integrate with OGC Web Mapping standards (how…?) • Maybe keep indexing method, use different mapping solution (provide data as polygons in GML or similar, to a more sophisticated mapper or web map client)
Resources available • C-squares initial published description (Mar 2003) – “Oceanography” vol. 16 (1)
Resources available • C-squares website at CMAR: http://www.cmar.csiro.au/csquares/(sample page)
Resources available • C-squares SourceForge site: http://csquares.sourceforge.net/
Resources available • C-squares on wikipedia: http://en.wikipedia.org/wiki/C-squares
Thank you! • Questions, comments invited… • Acknowledgements: Miroslaw Ryba, Philip Bohm [CMAR] (programming assistance); GD (graphics routine for the basic plotting); Xplanet (rendering engine for the “Globe Views”).
Thank You Contact CSIRO Phone: 1300 363 400+61 3 9545 2176Email: enquiries@csiro.auWeb: www.csiro.au Contact Name: Tony ReesTitle: Data Centre ManagerPhone: 03 6232 5318Email: Tony.Rees@csiro.auWeb: www.cmar.csiro.au/datacentre