Download
1 / 37
380 likes | 502 Views
Population Age Structures and National Transfer Accounts in Korea. Chong-Bum An and Eul-Sik Gim Sungkyunkwan University, Seoul, Korea. I. Introduction. Apply the NTA to Korea Compare the results to those of Taiwan and the United States

E N D
Population Age Structures and National Transfer Accounts in Korea Chong-Bum Anand Eul-Sik Gim Sungkyunkwan University, Seoul, Korea
I. Introduction • Apply the NTA to Korea • Compare the results to those of Taiwan and the United States Lee, R., A. Mason, and T. Miller (2003), From Transfers to Individual Responsibility: Implications for Savings and Capital Accumulation in Taiwan and the United States, Scandinavian Journal of Economics 105(3): 339-357. - Age-profile of production and consumption - Asset reallocations - Public and private transfers
II. Population Aging, Intergenerational Transfers and Savings in Korea
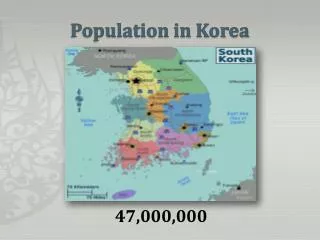
1. Population Aging • Demographic transition in Korea is dramatic. - Total fertility ratio decreases from 4.53 in 1970 to 1.19 in 2003. - Life expectancy increases from the age of 62.3 in 1971 to 77.9 in 2005, and projected to 83.3 in 2050. very rapid population aging. - Old age population is 7.2% in 2000 (aging society), to 14.3% in 2018 (aged society) to 20.8% in 2026 (post-aged society).
2. Intergenerational Transfers • Familial Support and Family Arrangements • ratio of parents living together with children • 54.7% in 1994 to 42.7% in 2002 • ratio of familial support for parents • 62.1% in 1994 to 53.3% in 2002. • ratio of households in which both adult children and old parents live together • 20.6% in 1975 to 9.4% in 2000.
Social Security System • Social insurances • National Pension Scheme (introduced in 1988) • National Health Insurance Scheme (introduced in 1977, expanded to all citizens in 1989), • Employment Insurance (introduced in 1995) • Industrial Accident Compensation Insurance (introduced in 1964). • Public assistances • National Basic Livelihood Security System (introduced in 1961, expanded to people under minimum cost of living in 2000), • medical aid, veterans’ relief, and disaster relief. • Social welfare services • protect the disabled, the aged, children, women, and mentally handicapped, etc. • three occupational pension insurances • government employees pension (introduced 1960) • military pension (separated from government employees pension in 1963) • teachers pension (introduced in 1973).
Education • Total public education expenditures • 4.60% of GDP in 1977 to 7.1% in 2000. • government’s burden • 2.44% in 1977 to 4.3% in 2000 • private sector’s burden • 2.16% in 1977 to 2.8% in 2000 • Private education expenditures (elementary, secondary) • 0.7% in 1977 to 2.9% in 2000.
3. Savings • total savings • 10% in 1960s to 40.4% in 1988 • decreases to 34.9% in 2004. • Public sector still shows high savings rate after financial crisis • corporations increases savings. • But individuals decreases savings.
1. Data Sources • records of public institutions • National Pension Statistical Yearbook • National Health Insurance Statistical Yearbook • income and expenditure surveys • National Survey of Household Income and Expenditure (NSHIE) • Korean Labor and Income Panel Study (KLIPS) • Household Income and Expenditure Survey (HIES).
2. National Accounts and National Transfer Accounts • National Disposable Income and its Appropriation Account (NDIAA) • Capital Transaction Account (CTA) • Financial Transactions Account (FTA) • External Transactions Account (ETA) • Roe E represents the conversion of National Accounts (NA) into National Transfer Flow Accounts (NTFA) • Income and Capital Accounts by Institutional Sectors and corresponding NTFA. • General government in National Accounts by Institutional Sectors is classified into public sector. • And non-financial corporations, financial corporations, and individuals are classified into private sector.
4. International Comparison • The Lifecycle Deficits • In three countries, children and the elderly consume substantially more than they produce. • In Korea, young adults begin to produce as much as they consume at age 27 • in Taiwan at age 22, in the US at age 24. • In Korea, adults no longer produce as much as they consume at age 55 • in Taiwan at age 56, in the US at age 57. • The span of years during which there is a lifecycle surplus is surprisingly short in three countries – in particular, 27 years in Korea.
production age profiles • similar until adults reach their early 40s. • Between the mid 40s and late 50s, however, the income profiles diverge. • age-profile of consumption • in Korea, increases continuously to late 10s, and decreases slowly over age of 20 • that of United States during that period increases continuously. • The case of Taiwan is similar to Korea.
steeper consumption profile in the US. • Korea and Taiwan are relatively flat. • Per capita consumption by those 65 and older was 136 % in the US of per capita consumption of those 20-64 • 84% in Korea; 86 % in Taiwan. • consider just non-health consumption, • the elderly and non-elderly adults in the US had virtually identical consumption, • while the elderly of Korea and Taiwan had non-health consumption equal to about 77%, 75% respectively of the non-health consumption of adults between the ages of 20 and 64.
The Reallocation System • In three countries, asset reallocations put inflows to most working ages, while public and private transfers put outflows at the same ages, • but in Korea asset reallocations generate inflows over mid 40s when we estimate private asset income and savings from the survey. • support children are quite similar in three countries. • Transfers dominate the reallocation system for children. • Private intra-household transfers accounted for about 60% in three countries.
old age reallocation systems are quite different • For Korea elderly asset reallocations plays very important role 79.3% of lifecycle reallocations 71% in the US; 50.1% in Taiwan • No Dis-savings in Korea 17.4% in the US, -0.4% in Taiwan • Bequests amounted to 10.3% in Korea 16.8% in the US; 16.6% in Taiwan.
In the US, public transfers are particular important. • Private transfers to the elderly are small in the US. • In Taiwan, Public transfers were 27.4% of total lifecycle reallocations for the elderly • private transfers excluding bequests were 39.1% of lifecycle reallocations. • In Korea, public transfers amounted to 11.1% • private transfers, 9.6% of total reallocations to the elderly.
Sources of Support • In three countries about 3~4% is from the earnings of children. • Inter vivos transfers constitute 54% in Korea; close to 60% in Taiwan and in the US. • Public transfers constitute 29% in Korea; 37% in the US; 34% in Taiwan. • The finance of consumption by the elderly is different • Work plays a similar role in three countries • Asset reallocations and inter vivos transfers are more important in Korea; • asset reallocations and public transfers are more important in the US; • Private, familial transfers are more important in Taiwan.
IV. Conclusions • Korea is now experiencing the fastest population aging in the world. • Intergenerational Transfers in Korea experiences the transition era • co-residence is decreasing • dependency on the social programs expands. • Growth also moves to a stage of slow speed. • Thus, a study of the reallocation of resources across age groups in Korea passing through such the transition can draw the sufficient attention. • The development of National Transfer Accounts enables us to show the current status of Korean intergeneration transfer and to predict the future.