Download
1 / 40
400 likes | 524 Views
Economic Impacts of the Border on Transportation. Transportation leadership you can trust. presented to Canada/U.S. Transportation Border Working Group presented by Stephen Fitzroy, Economic Development Research Group Andreas Aeppli, Cambridge Systematics, Inc. April 13, 2010.

E N D
Economic Impacts of the Border on Transportation Transportation leadership you can trust. presented to Canada/U.S. Transportation Border Working Group presented byStephen Fitzroy, Economic Development Research Group Andreas Aeppli, Cambridge Systematics, Inc. April 13, 2010
Presentation Overview • Project Summary • Case studies • Application of model on a real situation • Some thoughts for further action
Economic Impacts on Transportation of the United States/Canada Border • Main objective was to determine the economic consequences of delay at the US/Canada border, including: • impacts at specific border facilities or regions • macroeconomic effects for entire border • impacts of policy alternatives • Some key questions: • What are the impacts of freight versus passenger delay? • What commodities/industries are affected most? • How does the transport sector respond? • What role does reliability play?
Study Elements • Overview of Transborder Trade Data • Collect data and identify trends • Literature Review • Summarize relevant work • Identify advantages and limitations of applied methodologies • Develop Analytic Methodology • Logical approach • Compare to methods from literature review • Data requirements • Define three sample scenarios that reflect range of potential model application
Literature Review • Most relevant studies: • HDR|HLB (2006) – San Diego/Baja Border • Taylor et al. (2003) – US/Canada Border • DAMF (2005) – US/Canada Border (impacts to trucking firms) • Two broad approaches: • macroeconomic – measure supply and demand elasticities of response to time delay • microeconomic – measure costs at vehicle-level, determine how costs “flow” through economy • Room for improvement: • “delay” is not the only cost of crossing border • address travel time variability • add commodity dimension • recognize multiple freight carrier types
Key Considerations for Methodology • Many types of costs • travel time and variability • operating costs (fuel, capital, maintenance, labor, etc.) • administrative costs • Costs affect many economic players • passenger (commute, leisure, on-the-clock) • freight carriers (own-account, for-hire, common carriers) • freight shippers (bulk, mixed freight, small package, JIT firms) • Many possible responses to costs • Vehicle: mode/ route/ time-of-day • Firm: inventory management/ production technology/ site location • Household: tourism, employment, residential location • Data
Analyzing Border Delays Overview of analytic approach • Scenarios: • Changes in fees or charges • Change in processing time • Change in inspection policy • Change in hrs of operation • Change in security procedures Change in user costs by vehicle • Facility Capacity Response: • Change in processing time • Change in idle time • Change in reliability • Change in tolls • Demand Response: • Change in crossing demand • by trip purpose • Change in vehicle/freight mix • Change in crossing location • Change in crossing time of day
Overview of Methodology Methodology blends micro- and macro- approaches • Veh. Costs: • Trucks • Cars • Vehicle Users: • Households • Industry (pass.) • Freight shippers • Freight carriers macroeconomic elements • Users’ Responses: • Travel demand • Traveler spending • Carrier response • Shipper response • Regional Impacts: • Employment • Output • Value Added • Wages microeconomic elements
Implications • Addresses limitations of surveyed approaches • Vehicle based • Incorporates industry and macroeconomic responses • Includes travel time variability • Recognizes different truck carrier types • Impacts revealed at industry level • Additional features • Benefit/Cost analysis • Challenges • Appropriate data • Demand responses to cost changes
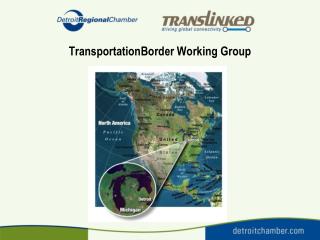
Three Sample Scenarios to Test BCM • Niagara Falls Peace Bridge improvements: • Analyze options for operational improvements to more efficiently handle traffic • Detroit – Windsor tunnel: • Assess the impact of the Western Hemisphere Travel Initiative (WHTI) on cross-border travel • Pacific Highway border crossing: • Examine the impact on travel times from expanded FAST implementation
Niagara Falls Peace Bridge Improvements • Problem: Assess proposed post-9/11 physical and operational improvements to approaches and processing plazas • Criteria/Needs to be addressed: • Inspection/Security • Safety • Structural Improvements/Renovations • Capacity/Reliability (during and after structural improvements) • Environmental/Externality Issues
Modeled Economy-Freight Relationship • Taxes, Fees • Regulations • Facilities Investment • Services Affected • Industry Output • Profit • Value Added • Jobs & Wages • Speed, Cost • Productivity • Market Access Freight-Focused Project or Policy Economic Change • Connectivity • Throughput Freight Flows • Commodity Value • Import/Export • Tonnage • Containers/Vehicles
Niagara Falls Peace Bridge Solutions • Multi-criteria investment evaluation • More than one “solution” must be implemented and tested in combination with others • Extended construction and interaction effects must be addressed • Costs and responses vary over time and differentially affect user segments and markets served • Timing, regional scale and industry impacts vary by policy/investment configurations and duration of activity
Detroit – Windsor Tunnel • Problem: Assess impact of WHTI on cross-border travel and the corresponding impacts on business sales, employment, tax revenue, wages, and output. • Criteria/Needs to be addressed: • Effect of current border crossing policies and restrictions on economy of Detroit and Windsor • Local spending (especially tourism) • Effects of labor markets and market access • Labor productivity impacts • Impacts on both US and Canadian economies
Modeled Economy - Passenger Relationship • Regulations • Facilities Investment • Security Procedures • Industry Output • Profit • Value Added • Jobs & Wages • Speed, Cost • Productivity • Market Access Alternative Border Policies Economic Impacts • Connectivity • Throughput Travel Decisions • Value of Time • VHT/VMT Savings • Household Spending
Modeled Passenger-Economy Relationship • Key issues to be addressed: • Benefits and costs of tunnel approach improvements • Procedural innovations to respond to alternative security levels • Robustness of procedures to respond to security alerts *and costs associated with implementing these procedures • Overall economic impacts of Detroit/Windsor region • Key employment and retail sectors believed to be affected • Effects of tunnel connectivity (and options – both capital and operational)
Detroit-Windsor Tunnel Solutions • Assessment must address: • Full range of regional economic impact measures • Ability to assess local, metro (two cities) and regional scales • Assessment of benefits and costs for multiple scenarios • Scenarios that include both policy and capital investment solutions • Include parking and traffic management at bridge approaches • Assess differential impacts by trip purpose
Pacific Highway Border Crossing • Problem: Assess proposed post-9/11 physical and operational improvements to approaches and processing plazas and evaluate effects of options to take advantage of current FAST “excess” capacity • Policy responses to be addressed: • Increase FAST enrollment • Mutual recognition of FAST enrolments for empty vehicles (73% of southbound moves are empty) • Use of pricing to allow non-FAST users to “purchase” unused FAST lane capacity when GP lane is congested • Convert FAST lane to: a) Priced lane; or b) GP lane • Retain FAST lane and convert one of two GP lanes to priced lane
Modeled Economy-Freight Relationship • Taxes, Fees • Regulations • Facilities Investment • Services Offered • Industry Output • Profit • Value Added • Jobs & Wages • Speed, Cost • Productivity • Market Access Freight-Focused Project or Policy Economic Change • Connectivity • Throughput Freight Flows • Commodity Value • Import/Export • Tonnage • Containers/Vehicles
Pacific Highway Border Crossing Solutions • Assess differential effects of user segments: • Relationships between delay reduction on commercial and passenger crossings • Evaluation of industry-specific market effects • Does commercial traffic increase, and if so, for which industry groups/commodity shippers • How do benefits move through economy: • How are operator cost savings passed through to shippers • How do shipper savings affect operations and markets served • What are the effects of non-commercial relay reductions on household expenditures
Application of BCM in Actual Situation • Analysis of fiber optic network installation at Vermont’s Derby Line/Highgate Springs Border Crossing • Problem: Assess impacts of pre-processing fully-laden trucks to reduce queuing times for all border traffic. • Criteria/Needs to be assessed: • Introduction of ITS to speed pre-approval and processing of laden trucks • Affect of delay and reliability at crossing and on I-89 and I-91 • Impacts on passenger cars, buses and empty trucks
Derby Line/Highgate Springs Border Crossing Canadian Customs Canadian Queue US-Canadian Border US Queue US Customs
Derby Line/Highgate Springs Border Crossing • Data Available: • Available vehicle entry data (USDOT, Customs and Border Protection, OMR database, December 2008) • DHS Survey of vehicle border crossing times (2008) • Analysis Approach: • Synthesize queuing distributions using current data • Estimate new queuing distribution(s) assuming: • 5-minute reduction in laden-vehicle median crossing time • average queue mix of passenger cars, laden trucks, empty trucks, and passenger buses • Minimum, average and standard deviation of processing time for each vehicle type
Modeled Economy-Freight Relationship • Taxes, Fees • Regulations • Facilities Investment • Services Offered • Industry Output • Profit • Value Added • Jobs & Wages • Speed, Cost • Productivity • Market Access Freight Project or Policy Economic Change • Connectivity • Throughput Freight Flows • Commodity Value • Import/Export • Tonnage • Containers/Vehicles
Derby Line/Highgate Springs Queuing • Average delays of 15 minutes propagate through peak queues and result in more than 5% of trucks experiencing 30-minute delays • Reductions of 5 minutes in median crossing produces 3-minute reduction in minimum times; reduction in standard deviation of 4 minutes; and results in less that 5% of trucks experiencing 20-minute delays • Inputs to model developed using queuing simulations of the build and no-build scenarios and comparing the differences
Derby Line/Highgate Springs Benefits • Border Queuing • Time savings for all vehicles (commercial and passenger) attributable to queue reduction at border • Safety • Crash reduction - injuries, property damage • Congestion Reduction • Value of congestion reduction on I-89 and I-91 throughout Vermont • Fuel Used and Emissions Reduction • Savings in fuel costs and reduced emissions costs
Border Crossing Model Advances and Limitations • Sensitivity of BCM to Transportation Factors Affecting Cross Border Trade • Spatial Coverage/Geographic Range of Impacts • System Output and Results
Sensitivity of BCM to Transportation Factors Affecting Cross Border Trade • Advantages and Modeling Innovations • Network operations (delay/Reliability) • Pricing and cost pass-through structures • Vehicle/load characteristics • Limitations • Differing detail on commodity flow information (O/D and routings) on US versus Canadian networks
BCM Spatial Coverage/Geographic Range of Impacts • Advantages and Model Innovations • Details on sub-state and sub-provincial economic data • Limitations • Interactive effects of macro-economic shifts/responses must be exogenously or iteratively addressed
BCM System Output and Results • Advantages and Model Innovations • Flexible reporting structure and consistent outputs • Addresses concerns of US DOT on methods and practices • Limitations • Sensitivity analysis (risk and uncertainty) associated with inputs and responses
Some Further Thoughts • Develop Comparable Cross-Border Economic Interaction Models • Integrate Cross-Border Commodity and Freight Routing Algorithms • Develop Financial Modeling and Accounting for Revenue and Innovative Financing Evaluation
Development of Provincial & Sub-Provincial I/O User Responses • Enhanced Social Accounting Structure • Stats Canada I/O • IMPLAN • Commodity flows and wage structure • Industry and commodity interactions for detailed industry impacts • Industry spending on labor and materials • Wage payments to employees for induced economic impacts Statistics Canada I/O Multipliers IMPLAN Commodity & Wage Structure Provincial Impacts
Tax Impact Analysis • Tax impacts for federal and state/local govt. • Contribution from households & businesses
Revenue & Cost Sharing Analysis • Input public & private sector responsibilities for construction, operation, maintenance, revenue collection • Internal rate of return (ROI), payback period, revenue/cost ratio