Download
1 / 27
270 likes | 396 Views
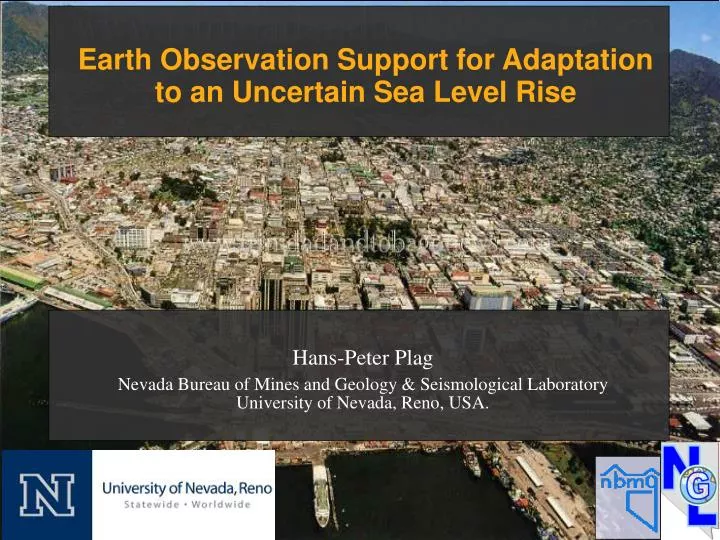
Earth Observation Support for Adaptation to an Uncertain Sea Level Rise. Hans-Peter Plag Nevada Bureau of Mines and Geology & Seismological Laboratory University of Nevada, Reno, USA. Earth Observation Support for Adaptation to an Uncertain Sea Level Rise. - The Societal Challenge

E N D
Earth Observation Support for Adaptation to an Uncertain Sea Level Rise Hans-Peter Plag Nevada Bureau of Mines and Geology & Seismological Laboratory University of Nevada, Reno, USA.
Earth Observation Support for Adaptation to an Uncertain Sea Level Rise - The Societal Challenge - The Scientific Challenge - Current “Best Practice” for LSL Assessments: the deterministic approach - LSL rise: An insurance problem?
“Sea-level hazard” is one of many hazards challenging society: - includes waves/currents/tides, storm surges, tsunamis, saltification; - is modified by slow changes of mean Local Sea Level (LSL). up to 50 cm/century < 10 cm/century < 10-20 cm/century Bindoff et al. (2007) - IPCC AR4
Basic societal and scientific assumption: Sea level changes very slowly and coast lines are mostly stable.
Paleo-records tell a different story ... Paleo-records of global sea level - demonstrate large changes: roughly 1.5 m/century during warming and peak rates of 4 m/century; - about 6,000 years ago, sea level became very stable; - humans could settle in the coastal zone and benefit from the many advantages of this location; - this stable phase made us (falsely) believe that ‘sea level doesn’t change very much.’ Hansen et al., 2009
Harrison & Stainforth (2009): “Atmospheric CO2 concentrations are now higher than they have been for at least the past 650,000 years ...” The Earth system may have passed some threshold values. Humanity has re-engineered the planet: The recent past and presents have only limited value for assessing the range of plausible futures,
We can not exclude that sea level becomes unstable. What if sea level becomes unstable again?
Today, with a sea level rise of 2-3 mm/yr, we see the potential impact of sea level rise combined with extremes in many places ... The UN Development Program, 2008: 332 million People live in low-lying coastal zones Damage caused by a single disaster could exceed $100 billion World Bank, 2008: * 1 m of sea level rise = 2% of GDP in East Asia The Societal Challenges: - Significant sea level rise would trigger extreme disasters; - There is trade-off between the costs for adaptation today and disasters tomorrow; - Coastal Defense is very expensive and there is a risk of overspending; - Adaptation may require relocation of settlements and infrastructure (airports, highways, pipelines, ...)
What do policy and decision makers ask science for? - Local sea level (LSL) rise predictions for the next 100 to 200 years, particularly high end; - deterministic predictions; reliable uncertainties; - full range of “plausible LSL trajectories” with probability density function (PDF);
The Science Challenge Local Sea Level (LSL): vertical distance between sea surface and land surface. LSL changes are caused by many Earth system processes acting on a wide range of spatial and temporal scales that change the sea surface height or the land surface height or both. LSL = high-frequency part + low-frequency part High-frequency part: result of local and regional processes, including waves, tides, storm surges, seiches, tsunamis, earthquakes, ... Low-frequency LSL variations are the result of local, regional, and global processes including temperature and salinity changes, circulation in ocean and atmosphere, past and present mass exchange with cryosphere and terrestrial water storage, geodynamics, ... All mass movements on the Earth surface: - change the geoid (gravity field); - displace the ocean bottom and land surface vertically; - redistribute water mass in the oceans.
The Science Challenge We understand the forcing processes .... ... but we have no Earth system model to predict LSL variations, taking into account, for example: - carbon emissions; - impact of re-engineering on climate; - ice sheets' response to global warming.
The Science Challenge “Best Practice” for LSL Assessments: - Local approach: sum of contributions from “most relevant” processes - Individual treatment of contributions, depending on predictability: extrapolation, model predictions, scenarios Current Situation: - Many assessments in the last 10 years; - Large range of plausible trajectories of future LSL; - Large uncertainties particularly for ice sheet contribution; - Due to new observations/knowledge out-dated within a few years; Blue: 2050 Red: 2100 Green: 2200
GRACE Detects Accelerated Ice Mass Loss in Greenland and Antarctica During the period of April 2002 to February 2009 the mass loss of the polar ice sheets was not constant but increased with time, implying that the ice sheets’ contribution to sea level rise was increasing. Greenland: - mass loss increased from 137 Gt/yr in 2002–2003 to 286 Gt/yr in 2007–2009 - acceleration of -30 ± 11 Gt/yr2 in 2002–2009. Antarctica: - mass loss increased from 104 Gt/yr in 2002–2006 to 246 Gt/yr in 2006–2009 - acceleration of -26 ± 14 Gt/yr2 in 2002–2009. Greenland Antarctica Velicogna, GRL,2009
The Science Challenge “Best Practice” for LSL Assessments: - Local approach: sum of contributions from “most relevant” processes - Individual treatment of terms, depending on predictability: extrapolation, model predictions, scenarios Current Situation: - Many assessments in the last 10 years; - Large range of plausible trajectories of future LSL; - Large uncertainties particularly for ice sheet contribution; - Due to new observations/knowledge out-dated within a few years; - Message of scientists is mixed, and partly contradicting, particularly with respect to current and potential contribution of the ice sheets; - No consensus about the upper limit for the next century or two.
Sea level rise is a slowly developing hazard that has its impact mainly during infrequent extreme events. How do we prepare for the impacts of LSL rise?
Reaction of Decision Makers: “‘We can’t make multi-billon dollar decisions based on the hypothetical’ says Rohit Aggarwala, the city’s director of long-term planning and sustainability.” Wall Street Journal, September 11, 2009, “New York City Braces for Risk of Higher Seas”
Current 'best practice' for LSL assessments does not provide actionable information. Deterministic approach does not work since we lack the capability to predict the future within reasonable uncertainties.
An Alternative Approach LSL rise is an “insurance problem”: Preparation for less likely, extreme LSL rise: - Extreme LSL rise (> 1 m/century) can not be excluded; - comparable to meteorite impact: Very unlikely but disastrous if it happens - “Early warning” when an extreme LSL rise is likely to occur. Knowing the LSL rise hazard: * Global map of LSL rise hazards, including statistics; * Statistics based on long-term paleo-record, not just recent past and model studies. Responding to the LSL rise hazard: How much do we want to spend on monitoring the hazard and on "early warning"? How much do we want to spend on reduction of vulnerability and risk?
“Early Warning” and LSL Forecasting Towards Forecasting of Local Sea Level Changes: - Monitor the main reservoirs in the global water cycle; - Develop models that can predict reservoir changes on decadal time scales; - Develop models that can relate reservoir changes to LSL; - aim for five to ten years and more. ...
“Early Warning” - LSL Forecasting - Planning - Adaptation Tide Gauges GRACE GNSS Reflections Laser Satellite Altimetry Radar Zufada & Zavorotny (2004) Publicly available GPS sites http://sealevel.colorado.edu/tidegauges.html
“Early Warning” - LSL Forecasting - Planning - Adaptation Towards Forecasting of Local Sea Level Changes: - Monitor the main reservoirs in the global water cycle; - Develop models that can predict reservoir changes on decadal time scales; - Develop models that can relate reservoir changes to LSL; - aim for five to ten years and more. ... What is needed to enable forecasting? - Maintain/improve the monitoring system (comparable to “Meteorite Watch”); - Community effort to develop the models needed for decadal predictions (in particular, mass changes in ice sheets, ocean and atmospheric circulation, loading); - Start forecasting as soon as possible to get a basis for the assessment of the forecasting capabilities. What is needed to increase resilience? - transition from deterministic predictions to statistical insurance approach; - understanding the possible trajectories and know the worst case; - focus on what is/can be resilient to large LSL changes; - planning for the worst case; - life cycle analysis for coastal projects taking into account the worst case.