Download
1 / 32
320 likes | 331 Views
Motion graphs Position (displacement) vs. time Distance vs. time Speed vs. times Velocity vs. time Acceleration vs. time. ________. Motion graphs Distance vs. Time. If linear Speed constant (zero acceleration) Slope represents the speed. Motion graphs Velocity vs. Time.

E N D
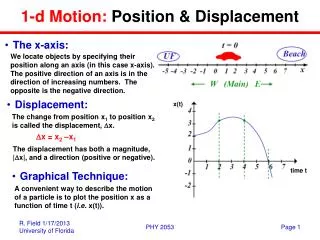
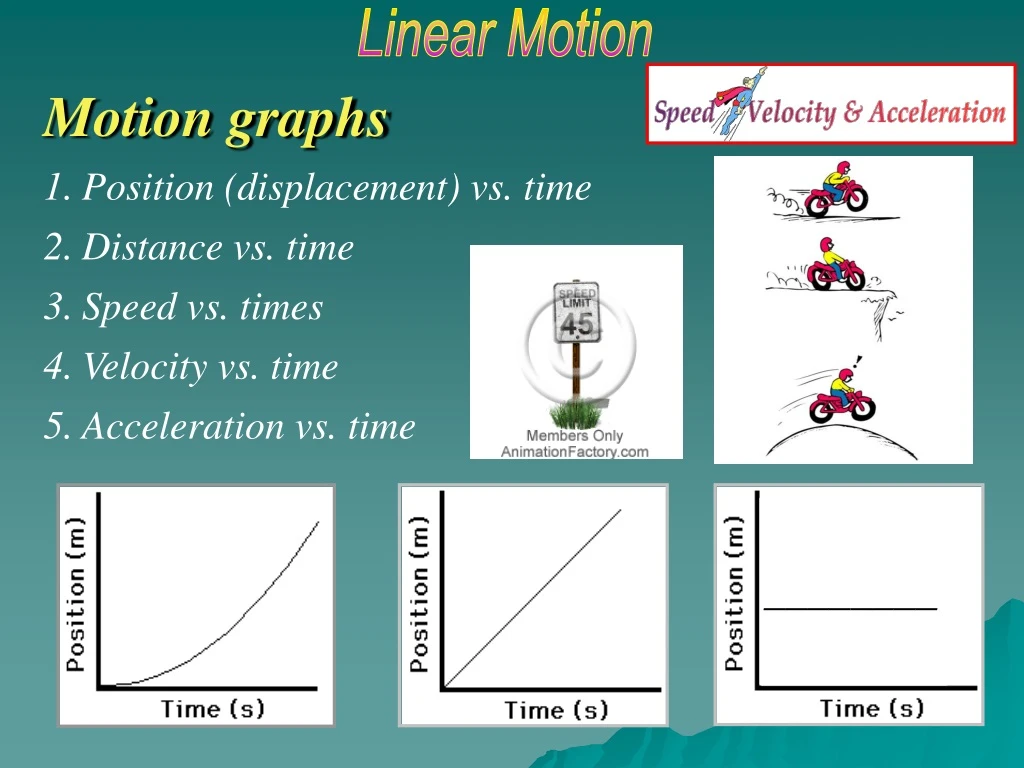
Motion graphs • Position (displacement) vs. time • Distance vs. time • Speed vs. times • Velocity vs. time • Acceleration vs. time ________
Motion graphs Distance vs. Time • If linear • Speed constant (zero acceleration) • Slope represents the speed
Motion graphs Velocity vs. Time • If linear (horizontal) • Speed constant (zero acceleration) • Slope represents the acceleration
Motion graphs Velocity vs. Time • If linear (non horizontal) • Speed constant (zero acceleration) • Slope represents the acceleration
Motion graphs Distance vs. Time • A car travels at a constant velocity, covering the same distance in equal time intervals, 50 km each hour. • An d-versus-t plot is therefore a straight line. The slope of the line is equal to the velocity. • The average velocity equals the instantaneous velocity in this case. Why?
Motion graphs Velocity vs. Time
Motion graphs Distance vs. Time • IF LINEAR • Speed constant • Slope = the speed • Speed vs. Time horizontal • Acceleration is zero • IF NON-LINEAR (parabolic) • Speed not constant • Speed changing at a constant rate • Speed vs. time linear • Slope of speed vs. time equals the acceleration • Acceleration non-zero constant
Motion graphs Distance vs. Time • The displacement-time graph of a body is as shown: • Calculate the velocity over the first 5-second period. • Calculate the velocity from 5s to 8s. • Calculate the velocity for the last two seconds. • What is the total displacement covered? • What is the average velocity over the entire 10-second stretch?
Motion graphs Distance vs. Time
Motion graphs Velocity vs. Time • Slope equals the acceleration • Area under the curve equals the displacement (distance)
Motion graphs Distance vs. Time
Motion graphs Speed vs. Time Area = 30 × 20 = 600 m. distance = speed × time. distance = 30 × 20 = 600 m Slope = acceleration Area under curve = distance/displacement
Motion graphs Velocity vs. Time Slope = acceleration Area under curve = distance/displacement
Motion graphs Velocity vs. Time link • The velocity-time graph of a body is as shown: • Over what time interval is the body not accelerating? • What is the acceleration between t = 0 and t = 5? • What is the total displacement covered by the body? • What is the average velocity between t = 0 and t = 8? • What is the average velocity between t = 0 and t = 10?
Motion graphs Speed vs. Time Slope = acceleration Area under curve = distance/displacement
Motion graphs Distance/Speed/Acceleration vs. Time
Motion graphs Distance/Speed/Acceleration vs. Time Constant Velocity Zero acceleration Increasing Velocity Constant positive acceleration
Motion graphs Distance/Speed/Acceleration vs. Time Link Increasing Positive Speed Area under speed curve equals the distance
Motion graphs Speed vs. Time Slope = acceleration Area under curve = distance/displacement
Motion graphs Acceleration vs. Time
Motion graphs Distance/Speed/Acceleration vs. Time Constant Positve Velocity
Motion graphs Distance/Speed/Acceleration vs. Time Constant Negative Velocity
Motion graphs Distance/Speed/Acceleration vs. Time Increasing Positive Velocity
Motion graphs Distance/Speed/Acceleration vs. Time Increasing Negative Velocity
Motion graphs Distance/Speed/Acceleration vs. Time Decreasing Negative Velocity
Motion graphs Distance/Speed/Acceleration vs. Time Decreasing Positive Velocity
Motion graphs Distance/Speed/Acceleration vs. Time
link Motion graphs Distance/Speed/Acceleration vs. Time