Download
1 / 32
320 likes | 390 Views
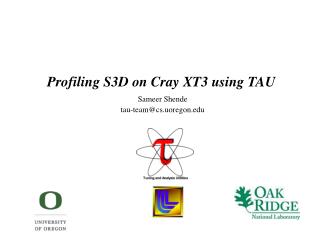
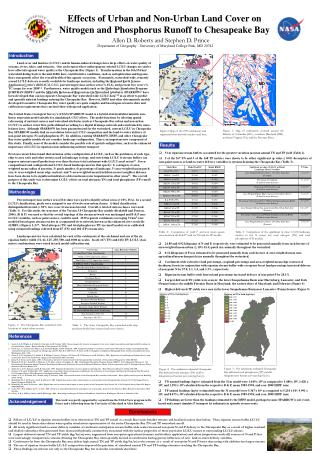
Parallel Performance Technology for Scientific Application Competitiveness: the TAU Parallel Performance System Project. Allen D. Malony malony@cs.uoregon.edu http://www.cs.uoregon.edu/research/tau Department of Computer and Information Science Performance Research Laboratory

E N D
Parallel Performance Technology for ScientificApplication Competitiveness:the TAU Parallel Performance System Project Allen D. Malony malony@cs.uoregon.edu http://www.cs.uoregon.edu/research/tau Department of Computer and Information Science Performance Research Laboratory University of Oregon
Acknowledgements • Dr. Sameer Shende, Senior scientist • Alan Morris, Senior software engineer • Wyatt Spear, Software engineer • Scott Biersdorff, Software engineer • Li Li, Ph.D. student • Kevin Huck, Ph.D. student • Aroon Nataraj, Ph.D. student • Brad Davidson, Systems administrator
TAU Performance System • Tuning and Analysis Utilities (14+ year project effort) • Performance system framework for HPC systems • Integrated, scalable, flexible, and parallel • Targets a general complex system computation model • Entities: nodes / contexts / threads • Multi-level: system / software / parallelism • Measurement and analysis abstraction • Integrated toolkit for performance problem solving • Instrumentation, measurement, analysis, and visualization • Portable performance profiling and tracing facility • Performance data management and data mining • Partners: LLNL, ANL, Research Center Jülich, LANL
TAU Parallel Performance System Goals • Portable (open source) parallel performance system • Computer system architectures and operating systems • Different programming languages and compilers • Multi-level, multi-language performance instrumentation • Flexible and configurable performance measurement • Support for multiple parallel programming paradigms • Multi-threading, message passing, mixed-mode, hybrid, object oriented (generic), component-based • Support for performance mapping • Integration of leading performance technology • Scalable (very large) parallel performance analysis
TAU Instrumentation Approach • Support for standard program events • Routines, classes and templates • Statement-level blocks • Support for user-defined events • Begin/End events (“user-defined timers”) • Atomic events (e.g., size of memory allocated/freed) • Selection of event statistics • Support definition of “semantic” entities for mapping • Support for event groups (aggregation, selection) • Instrumentation optimization • Eliminate instrumentation in lightweight routines
TAU Instrumentation Mechanisms • Source code • Manual (TAU API, TAU component API) • Automatic (robust) • C, C++, F77/90/95 (Program Database Toolkit (PDT)) • OpenMP (directive rewriting (Opari), POMP2 spec) • Object code • Pre-instrumented libraries (e.g., MPI using PMPI) • Statically-linked and dynamically-linked • Executable code • Dynamic instrumentation (pre-execution) (DynInstAPI) • Virtual machine instrumentation (e.g., Java using JVMPI) • TAU_COMPILER to automate instrumentation process
User-level abstractions problem domain linker OS Multi-Level Instrumentation and Mapping • Multiple interfaces • Information sharing • Between interfaces • Event selection • Within/between levels • Mapping • Associate performance data with high-level semantic abstractions source code instrumentation preprocessor instrumentation source code instrumentation compiler instrumentation object code libraries executable instrumentation instrumentation runtime image instrumentation instrumentation VM performancedata run
TAU Measurement Approach • Portable and scalable parallel profiling solution • Multiple profiling types and options • Event selection and control (enabling/disabling, throttling) • Online profile access and sampling • Online performance profile overhead compensation • Portable and scalable parallel tracing solution • Trace translation to EPILOG, VTF3, and OTF • Trace streams (OTF) and hierarchical trace merging • Robust timing and hardware performance support • Multiple counters (hardware, user-defined, system) • Performance measurement for CCA component software
TAU Measurement Mechanisms • Parallel profiling • Function-level, block-level, statement-level • Supports user-defined events and mapping events • TAU parallel profile stored (dumped) during execution • Support for flat, callgraph/callpath, phase profiling • Support for memory profiling (headroom, leaks) • Tracing • All profile-level events • Inter-process communication events • Inclusion of multiple counter data in traced events
Types of Parallel Performance Profiling • Flatprofiles • Metric (e.g., time) spent in an event (callgraph nodes) • Exclusive/inclusive, # of calls, child calls • Callpath profiles (Calldepth profiles) • Time spent along a calling path (edges in callgraph) • “main=> f1 => f2 => MPI_Send” (event name) • TAU_CALLPATH_LENGTH environment variable • Phase profiles • Flat profiles under a phase (nested phases are allowed) • Default “main” phase • Supports static or dynamic (per-iteration) phases
Performance Analysis and Visualization • Analysis of parallel profile and trace measurement • Parallel profile analysis • ParaProf: parallel profile analysis and presentation • ParaVis: parallel performance visualization package • Profile generation from trace data (tau2pprof) • Performance data management framework (PerfDMF) • Parallel trace analysis • Translation to VTF (V3.0), EPILOG, OTF formats • Integration with VNG (Technical University of Dresden) • Online parallel analysis and visualization • Integration with CUBE browser (KOJAK, UTK, FZJ)
ParaProf Parallel Performance Profile Analysis Raw files HPMToolkit PerfDMFmanaged (database) Metadata MpiP Application Experiment Trial TAU
ParaProf – Flat Profile (Miranda, BG/L) node, context, thread 8K processors Miranda hydrodynamics Fortran + MPI LLNL Run to 64K
ParaProf – Callpath Profile (Flash) Flash thermonuclear flashes Fortran + MPI Argonne
ParaProf – Scalable Histogram View (Miranda) 8k processors 16k processors
ParaProf – 3D Full Profile (Miranda) 16k processors
ParaProf – 3D Full Profile (Flash) 128 processors
ParaProf – 3D Scatterplot (Miranda) • Each pointis a “thread”of execution • A total offour metricsshown inrelation • ParaVis 3Dprofilevisualizationlibrary • JOGL
Performance Data Management (PerfDMF) K. Huck, A. Malony, R. Bell, A. Morris, “Design and Implementation of a Parallel Performance Data Management Framework,” ICPP 2005.
Performance Data Mining (PerfExplorer) K. Huck and A. Malony, “PerfExplorer: A Performance Data Mining Framework For Large-Scale Parallel Computing,” SC 2005, Thursday, 11:30, Room 606-607.
PerfExplorer Analysis Methods • Data summaries, distributions, scatterplots • Clustering • k-means • Hierarchical • Correlation analysis • Dimension reduction • PCA • Random linear projection • Thresholds • Comparative analysis • Data management views
Correlation Analysis (Flash) • Describes strength and direction of a linear relationship between two variables (events) in the data
Flash Clustering on 16K BG/L Processors • Four significant events automatically selected • Clusters and correlations are visible
ZeptoOS and TAU • DOE OS/RTS for Extreme Scale Scientific Computation • ZeptoOS • scalable components for petascale architectures • Argonne National Laboratory and University of Oregon • University of Oregon • Kernel-level performance monitoring • OS component performance assessment and tuning • KTAU (Kernel Tuning and Analysis Utilities) • integration of TAU infrastructure in Linux kernel • integration with ZeptoOS • installation on BG/L • Argonne booth demo/talk: T/W/Th 3:30-4:00 pm
Linux Kernel Profiling using TAU – Goals • Fine-grained kernel-level performance measurement • Parallel applications • Support both profiling and tracing • Both process-centric and system-wide view • Merge user-space performance with kernel-space • User-space: (TAU) profile/trace • Kernel-space: (KTAU) profile/trace • Detailed program-OS interaction data • Including interrupts (IRQ) • Analysis and visualization compatible with TAU
KTAU System Architecture A. Nataraj, A. Malony, S. Shende, and A. Morris, “Kernel-level Measurement for Integrated Performance Views: the KTAU Project,” Cluster 2006, distinguished paper.
TAU Performance System Status • Computing platforms • IBM, SGI, Cray, HP, Sun, Hitachi, NEC, Linux clusters, Apple, Windows, … • Programming languages • C, C++, Fortran 90/95, UPC, HPF, Java, OpenMP, Python • Thread libraries • pthreads, SGI sproc, Java,Windows, OpenMP • Communications libraries • MPI-1/2, PVM, shmem, … • Compilers • IBM, Intel, PGI, GNU, Fujitsu, Sun, NAG, Microsoft, SGI, Cray, HP, NEC, Absoft, Lahey, PathScale, Open64
Support Acknowledgements • Department of Energy (DOE) • Office of Science • MICS, Argonne National Lab • ASC/NNSA • University of Utah ASC/NNSA Level 1 • ASC/NNSA, Lawrence Livermore National Lab • Department of Defense (DoD) • HPC Modernization Office (HPCMO) • Programming Environment and Training (PET) • NSF Software and Tools for High-End Computing • Research Centre Juelich • Los Alamos National Laboratory • ParaTools, Inc.

![[PDF] Free Download Tau Zero By Poul Anderson](https://cdn4.slideserve.com/8282825/slide1-dt.jpg)