Download
1 / 18
180 likes | 255 Views
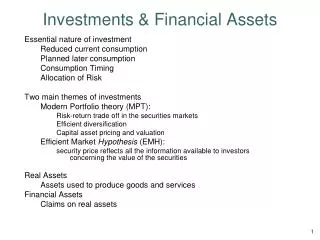
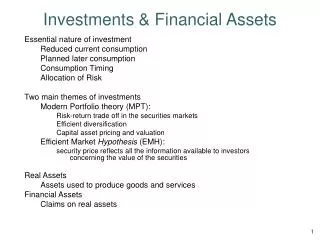
Natural Infrastructure Investments and the Nexus: A Global Overview. Genevieve Bennett, Forest Trends’ Ecosystem Marketplace March 2014. Who we are. The infrastructure gap. Estimated Global Annual Infrastructure Investment Needs by 2030 $ billions. Electricity Transmission and Distribution

E N D
Natural Infrastructure Investments and the Nexus: A Global Overview Genevieve Bennett, Forest Trends’ Ecosystem Marketplace March 2014
The infrastructure gap Estimated Global Annual Infrastructure Investment Needs by 2030 $ billions Electricity Transmission and Distribution $80 Water Infrastructure $1,000 Roads $160 SOURCE: Source: OECD (2006). "Infrastructure to 2030: Telecom, Land Transport, Water and Electricity."
Why natural infrastructure? Managing our landscapes as natural infrastructure which means identifying the services they provide that we depend on like pollution filtration or flood control and protecting those services, or compensating the people who do. SOURCE: Charting New Waters: State of Watershed Payments 2012.
Current state of finance Eco-markets: Global values 2008-2013 $ millions 205 active projects 77in development $8.2 billion transacted in 2011 117 million ha under management that year SOURCE: Ecosystem Marketplace’s ‘State of’ reports series
Investments by region Value of Watershed Investment Programs, 2011 $ millions SOURCE: Charting New Waters: State of Watershed Payments 2012.
The “classic model” SOURCE: Charting New Waters: State of Watershed Payments 2012.
Who’s paying? Share of investments by payer type Percentage of total transaction values, globally China Beneficiary pays: 3% Public good payer 97% Not China • Polluter Pays: <1% SOURCE: Charting New Waters: State of Watershed Payments 2012.
Investments in practice SOURCE: Charting New Waters: State of Watershed Payments 2012.
What about the private sector? SOURCE: State of Watershed Payments: Executive Summary for Business, 2013, and Gassert et al, Aqueduct Global Maps 2.0, 2013.
Landscape-scale risks overlooked? 67% of businesses managing water risk on-site 4% managing risk in the supply chain 3% managing risk at the watershed level SOURCE: CDP Global Water Report 2013.
Why business is investing Drivers of business investments in 2011 # of projects reporting driver SOURCE: State of Watershed Payments: Executive Summary for Business, 2013.
Case study: Lake Naivasha, Kenya Sediment Fertilizer Reduced flows in dry season Surges in wet season New geothermal power plant Hotels Flower-growing businesses Technical assistance Vouchers for agricultural inputs (worth $17/per household/year) Ranchers High-value crop seeds LAKE NAIVASHA WATER RESOURCE USERS ASSOCIATION Harvest revenues 30x higher than value of original voucher payment SOURCE: State of Watershed Payments 2012.
Natural infrastructure and the nexus Projects funding sustainable agricultural practices % of projects OECD countries Non-OECD Africa Non-OECD Asia Non-OECD Latin America Non-agriculture
Natural infrastructure and the nexus Projects with funders in the energy sector % of projects OECD countries OECD countries, proposed Non-OECD Africa Non-OECD Africa, proposed Non-OECD Asia Non-OECD Asia, proposed Non-OECD Latin America Non-energy
How do we facilitate investment? X FACTORS: Multilateral finance for water and energy infrastructure Post-2015 SDGs on water and the nexus Guidance and incentives for business Natural capital accounting BAU
Thank you Genevieve Bennett Forest Trends’ Ecosystem Marketplace gbennett@forest-trends.org
Models for business investment SOURCE: State of Watershed Payments: Executive Summary for Business, 2013.