Download
1 / 34
340 likes | 443 Views
Automatic Discovery of Shared Interest Minimum Spanning Trees Displaying Semantic Similarity. Włodzisław Duch & Co Department of Informatics , Nicolaus Copernicus University, Torun, Poland, & School of Computer Engineering, Nanyang Technological University, Singapore Google: Duch. The Vision.

E N D
Automatic Discovery of Shared Interest Minimum Spanning Trees Displaying Semantic Similarity Włodzisław Duch & Co Department of Informatics, Nicolaus Copernicus University, Torun, Poland, & School of Computer Engineering, Nanyang Technological University, Singapore Google: Duch
The Vision • Vannevar Bush imagined in 1945 linked text/film information, a kind of Wikipedia, his Memex was first hypertext systems. • Ted Nelson in “Computer Lib and Dream Machines” (1974) extended this vision to all kinds of information integrated in project Xanadu, a project founded in 1960. In essence:unbreakable two-way links, connected to origin of info, facilitating incremental publishing, deep version management & comparison. • WWW is not yet Xanadu, no links to origin of information, little maintenance, searches are frequently tedious, and linking information about any given subject is done in manual way. • Xanadu vision is not sufficient; all knowledge should be organized in form of ideas supported by evidence, with links between related pieces of information automatically created (QED project). • If only computes could analyze and present it in coherent way, linking major ideas to papers, data, software, experiments ...
The Problem • Finding all people who share similar interests in large organizations or worldwide is difficult (NTU experience). Find who is related to me and in which way? • Each individual may have many different interests so the search process should be topic-oriented, not people-oriented. • The process should be automatic – use info on people’s homepages and their lists of publications. • Visualize relations using graphs with individuals as nodes and different type of relations as edges. • The structure of the graphical representation depends strongly on the selection of key entities of the nodes – text should be projected first on domain ontology.
Steps • WWW spiders used to collect documents from some domain (NTU home pages have been used for tests). • Convert html documents to text, clean using stop-words, apply stemming etc. • Final filtering & dimensionality reduction to obtain vector representation of the term-document matrix. • Cluster info in some way (try Clusty, Vivisimo or Carrot2). • Visualize related nodes that represent individual homepages, link them by estimates of similarity of shared interest: see Websom and its applications in digital lib, astro VizieR etc. This goes beyond visualization of Google link analysis or “the brain interface” use in Britannica BrainStormer.
Document-word matrix • Document1: word1 word2 word3. word4 word3 word5. • Document2:word1 word3 word5. word1 word3 word6. • The matrix: documents x word frequencies Document 1 W1 W2 W3 W4 W5 W6 Document 2
First shot: methods used • Inverse document frequency and term weighting. • Simple selection of relevant terms or • Latent Semantic Analysis (LSA) for dimensionality reduction – standard method in info retrieval. • Minimum Spanning Trees for visual representation. • TouchGraph XML visualization of MST trees.
Data Preparation • Normalize columns of F dividing by highest word frequencies: • Among n documents, term j occurs djtimes; inverse document frequency idfj measures uniqueness of term j: • tf x idfterm weights:
Simple selection • Take wij weights above certain threshold, binarize and remove zero rows: • Calculate similarity using cosine measure (takes care of the vector length normalization):
Similarity using cosine measure Using the same vectors, V1 ,V2 ,V3 Similarity of vector 1 and vector 2 is S12=0.615, and S13=0.1811. Document 1 and Document 2 are more likely to be related. For visualization a threshold value (ex. Sij > 0.3) which will determine which links to show is used.
Dimensionality reduction • Latent Semantic Analysis (LSA): use Singular Value Decomposition on weight matrix W with U = eigenvectors of WWT and V of WTW. Remove small eigenvalues from L, recreate reduced W and calculate similarity:
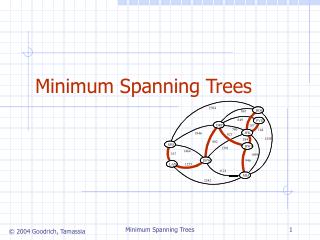
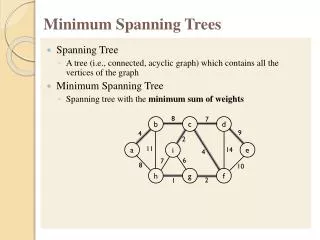
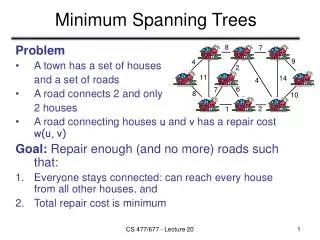
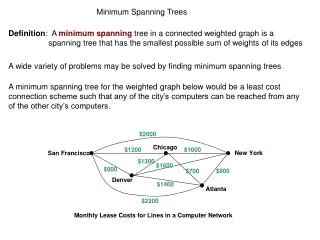
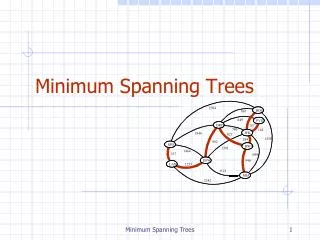
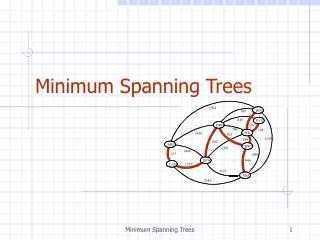
Kruskal’s MST Algorithm and Top - Down Clusterization Minimum spanning tree = weighted graph with minimum total cost, created by a simple greedy algorithm.
Some experiments: • Reuters-215785 datasets, with 5 categories and 1 – 176 elements per category, 600 documents: can we see categories? • 124 Personal Web Pages of the School of Electrical and Electronic Engineering (EEE) of the Nanyang Technological University (NTU) in Singapore. • 5 department names may be used as categories: control, microelectronics, information, circuit, power, with 14 – 41 documents per category.Can we discover department structure?
Reuters results For 600 documents W rank in SVD is Wrank= 595 Method topics clusters accuracy No dim red. 41 129 78.2% LSA dim red. 0.8 (476) 41 124 76.2% LSA dim red. 0.6 (357) 41 127 75.2% Simple Selection 41 130 78.5% 0.8 means 0.8*Wrank eigenvectors retained
Results for EEE NTU Web pages Method topics clusters accuracy No dim red. 10 142 84.7% LSA dim red. 0.8 (467) 10 129 84.7% LSA dim red. 0.6 (350) 10 137 82.8% Simple Selection 10 145 85.5%
Examples • Live demo http://www.neuron.m4u.pl/search • EEE full • EEE Selected • EEE Selected small clusters
Limitations • Keywords have been derived from what we find on web pages only, too many, too sparse matrices. • Synonymous concepts should be treated as a single feature, producing larger frequency counts. • People working on “architecture in mechanical design” who are interested in “computer art” are associated with someone in “computer architecture”. • Web pages contain many irrelevant information. • Abbreviations of all sorts are used. • No topics, therefore only a single category used.
Adding ontologies • Select relevant terms using engineering ontologies (from keywords used in library classification) • Add medical concepts (ULMS) and use MetaMap to discover these concepts in text. • Processing: Term weighting, stemming etc • Simple selection of relevant terms. • TouchGraph XML visualization
Results for Summary Discharges New experiments on medical texts. Short (~ half page) hospital summary discharges. 10 classes and 10 documents per class = main disease treated. • Plain Doc-Word matrix ≈ 23% • Stop-List, TW-IDF, S.S. ≈ 64% • Metamap Transformation ≈ 93%
Summary • In real application knowledge-based approach is needed to select relevant concepts and to parse web pages but problems with acronyms, abbreviations, synonyms etc should be solved. • Other visualization and clusterization methods should be explored. • People have many interests and thus may belong to several topic groups – topics are related to concepts that should be high in ontology, but have no simple description. • Could be a very useful tool to create new shared interest groups for social networks in the Internet. • Could point out to potential collaborators or interesting research from individual point of view.
Similar attempts Flink is presentation of the scientific work and social connectivity of Semantic Web reseachers, displaying homepages of experts who have contributed to the International Semantic Web Conference (ISWC) series. • http://flink.semanticweb.org Kartoo is a metasearch engine that displays topic maps: • http://www.kartoo.com
Related work in my group • Neural basis of language: creation of network of concepts instead of vector models. • Medical text analysis using UMLS ontologies. • Instead of clustering formulate minimum number of questions to define more precise search. • Creativity – inventing new names.
Words in the brain The cell assembly model of language has strong experimental support; F. Pulvermuller (2003) The Neuroscience of Language. On Brain Circuits of Words and Serial Order. Cambridge University Press. Acoustic signal => phonemes => words => semantic concepts. Semantic activations are seen 90 ms after phonological in N200 ERPs. Perception/action networks, results from ERP& fMRI. Phonological density of words = # words that sound similar to a given word, that is create similar activations in phonological areas. Semantic density of words = # words that have similar meaning, or similar extended activation network.
Words: simple model Goals: • make the simplest testable model of creativity; • create interesting novel words that capture some features of products; • understand new words that cannot be found in the dictionary. Model inspired by the putative brain processes when new words are being invented. Start from keywords priming auditory cortex. Phonemes (allophones) are resonances, ordered activation of phonemes will activate both known words as well as their combinations; context + inhibition in the winner-takes-most leaves one or a few words. Creativity = imagination (fluctuations) + filtering (competition) Imagination: many chains of phonemes activate in parallel both words and non-words reps, depending on the strength of synaptic connections. Filtering: associations, emotions, phonological/semantic density.
Beyond ontologies Neurocognitive approach to language understanding: use recognition, semantic and episodic memory models, create graphs of consistent concepts for interpretation, use spreading activation and inhibition to simulate effect of semantic priming, annotate and disambiguate text. For medical texts ULMS has >2Mconcepts, 15Mrelations … See: Unambiguous Concept Mapping in a Medical Domain, Thursday 11:45 (Matykiewicz, Duch, Pestian).
Query Semantic memory Applications, eg. 20 questions game Humanized interface Store Part of speech tagger & phrase extractor verification On line dictionaries Parser Manual
Web/text/databases interface Text to speech NLP functions Natural input modules Talking head Behavior control Cognitive functions Control of devices Affectivefunctions Specialized agents DREAM modules DREAM project is focused on perception (visual, auditory, text inputs), cognitive functions (reasoning based on perceptions), natural language communication in well defined contexts, real time control of the simulated/physical head.
Thank youfor lending your ears ... Google: Duch => Papers