Download
1 / 20
200 likes | 260 Views
Spaced-based measurements (VLBI and GPS) show that PAC-NA motion in CA is ~50 mm/yr. Earthquakes in California & Nevada, 1970-2003. The San Andreas is NOT “the PAC-NA plate boundary.”. Red arrow : predicted motion: 50 mm/yr. Blue arrows : subsets of the motion that

E N D
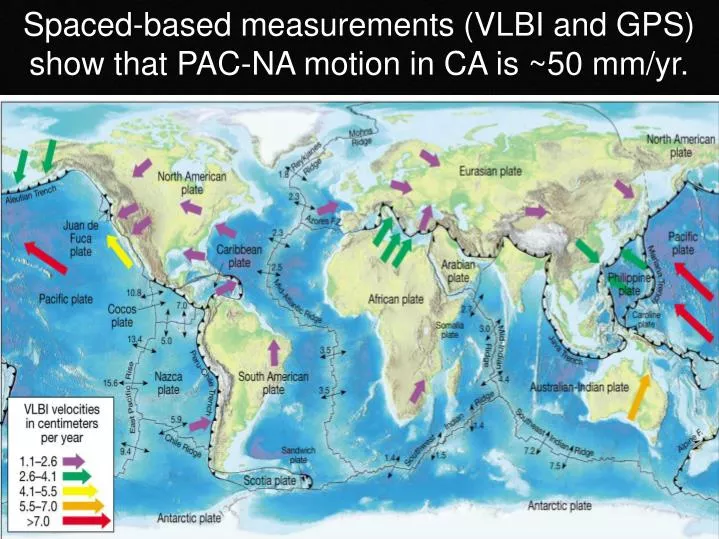
Spaced-based measurements (VLBI and GPS) show that PAC-NA motion in CA is ~50 mm/yr.
The San Andreas is NOT “the PAC-NA plate boundary.” Red arrow: predicted motion: 50 mm/yr Blue arrows: subsets of the motion that “add up” to the predicted motion. This diagram applies at the latitude of Bakersfield or San Luis Obispo.
4-8? About 36 mm/yr happens on the San Andreas in central CA, but northwest of Hollister, things are a LOT messier. 9 23 >6 ~Stockton 9 17-23 2-5? Farallon Islands The ~36 mm/yr must be divided up on many faults. Geologists study each to determine individual rates. 6 9 17 7-10? 1-3? Let’s add up the slip on faults along four paths to see whether we’ve found the ~36 mm/yr. 15 17? 23?
Seismic Hazards and Risks Seismic hazard: A natural process caused by an EQ Seismic risk: The potential for casualties and property loss due to a seismic hazard or hazards. Example 1: Landslide in built-up Los Gatos vs. landslide in the Sierra Nevada backcountry Example 2: Tsunami at Los Angeles harbor vs. tsunami at the Big Sur coastline.
Natural Seismic Hazards Surface rupture Landslides Dust & Disease Tsunamis Liquefacton & subsidence Ground shaking
Surface Rupture Earth’s surface breaks and shif ts at an active fault. Only affects construction built directly atop the fault. Affects the smallest area of all the seismic hazards. Includes creep and earthquakes. How could you evaluate the level of risk due to surface rupture?
Landslides Downslope movement of Earth materials due to gravity Most affect soil or loose sediment, but some affect rock. May be triggered by earthquakes or heavy rainfall. How could you evaluate the level of risk due to landslide?
Tsunami Destructive sea waves (NOT tidal waves) Caused by processes that abruptly moves ocean water: earthquake submarine volcanic eruption coastal/submarine landslide ET impact Time of arrival can be predicted—public warnings How could you evaluate the level of risk due to tsunami?
Possible tsunami “run-up” zones
Liquefaction Accompanies M6+ EQs. Water escape often causes the ground surface to subside. Subsidence can damage pipes, foundations, etc. How could you evaluate the level of risk due to liquefaction & subsidence?
Ground Shaking Due to passage of P, S, and surface waves Ground type controls amplitude and duration of shaking: Bedrock shakes least, shortest Mud-rich soil shakes most, longest How could you evaluate the level of risk due to ground shaking?
Effect of Ground Type on Shaking Seismograms for a M4 aftershock of the 1989 Loma Prieta earthquake.