Download
1 / 30
300 likes | 409 Views
The National Survey of Family Growth. Stephanie J. Ventura, M.A. National Center for Health Statistics Presented at the 134th Annual Meeting & Exposition of the American Public Health Association Continuing Education Institutes November 4, 2006 Boston, MA. The NSFG’s Role.

E N D
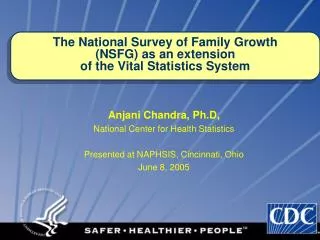
The National Survey of Family Growth Stephanie J. Ventura, M.A. National Center for Health Statistics Presented at the 134th Annual Meeting & Exposition of the American Public Health AssociationContinuing Education Institutes November 4, 2006Boston, MA
The NSFG’s Role • Responds to Sec 306 of the PHS Act: • “NCHS...shall collect statistics on family formation, growth, and dissolution.” • Extends the birth registration system by providing data on behaviors that explain birth and pregnancy rates--- e.g. sexual activity, contraception, infertility, & breastfeeding. • Serves the needs of other DHHS programs • NICHD, OPA, OASPE, ACF’s OPRE & Children’s Bureau • CDC’s DRH; HIV Prevention Program (DHAP); & OWH.
Fertility Intermediate variables Social factors Intercourse variables: Timing of first intercourse Percent of women who ever had intercourse Time spent in marriage (separation, divorce, cohabitation) Frequency of intercourse Race/ethnicity Religion Labor force participation Education Income Access to health care Family background Community environment (economic, social, etc) Conception variables: Contraceptive use Sterilization Infertility Pregnancy outcome (gestational) variables: Miscarriage and stillbirth Induced abortion Live births
2002 NSFG data collection • Contractor: Institute for Social Research (ISR), University of Michigan • National sample in 121 areas • Blacks, Hispanics, teens over-sampled • In-person interviews using laptop computers • Interviews in both English and Spanish (929 in Spanish)
Selected NSFG 2002 Content Interviewer-Administered: • Pregnancy history (women); fatherhood history (men); • Marriage & cohabitation history,* sexual partner history • Contraceptive history;* Wanted & unwanted births* • Attitudes about marriage, parenthood, children Self-administered: • Sexual behavior, sexual orientation and attraction, drug use, forced sex, income. *more detailed for women than for men.
First example: Contraceptive use Measures in the NSFG • Females • “Have you ever used...?” (19 methods). • Method used at first and last sex • Current contraceptive use (up to 4 methods) • What methods she and her partner(s) used in each month over the past 3 years (including use in the month of interview) • Males • Contraceptive use asked about within relationships and marriages • Contraceptive use asked about for first & last intercourse with each of up to 3 “most recent partners” • Consistency of condom use past 4 weeks & last 12 months
Women’s contraceptive use at interview by method: US, 1995 & 2002 Percent 2002 1995 Implant, Patch, Lunelle Calendar Rhythm & NFP Female Sterilization Male Sterilization Pill Injectable (Depo) Male Condom With-drawal Other IUD/ Diaphram SOURCE: Mosher WD, Martinez GM, Chandra A, Abma JC, Willson SJ. Use of Contraception and Use of Family Planning Services in the United State: 1982-2002. Dec 2004. National Center for Health Statistics. Advance Data 350.
Percent of women contraceptors 22-44 who were currently using female sterilization or the pill, by education: US, 2002 Female Sterilization Pill SOURCE: Mosher WD, Martinez GM, Chandra A, Abma JC, Willson SJ. Use of Contraception and Use of Family Planning Services in the United State: 1982-2002. Dec 2004. National Center for Health Statistics. Advance Data 350.
Second example: Wantedness of pregnancies The traditional concepts • Intended/wanted:Respondent wanted to get pregnant/ Respondent wanted his spouse or partner to get pregnant at about or before the time it happened • Unintended: Unwanted + Mistimed • Unwanted:Respondent did not want to have a baby of that birth order, ever. • Mistimed:Respondent wanted a baby, but not when it happened.
Percentage of births in the five years before the interview that were unintended at conception by respondent’s education1 1Limited to births to respondents 22-44 years of age SOURCES: Chandra A, Martinez GM, Mosher WD, Abma JC, Jones J. Fertility, Family Planning, and Reproductive Health of U.S. Women: Data from the 2002 National Survey of Family Growth. Vital and Health Statistics. Series 23, No. 25. Hyattsville, MD: National Center for Health Statistics. 2005. Martinez GM, Chandra A, Abma JC, Jones J, and Mosher WD. Fertility, Contraception, and Fatherhood: Data on Men and Women from Cycle 6 (2002) of the National Survey of Family Growth. Vital and Health Statistics. Series 23, No. 26. Hyattsville, MD: National Center for Health Statistics. 2006.
Percent of women who smoked during their most recent pregnancy ending in 1997-2002: US, 2002 Public assistance in last 12 months Wantedness at time of conception SOURCE: Chandra A, Martinez GM, Mosher WD, Abma JC, Jones J. Fertility, Family Planning, and Reproductive Health of U.S. Women: Data from the 2002 National Survey of Family Growth. Vital and Health Statistics. Series 23, No. 25. Hyattsville, MD: National Center for Health Statistics. 2005.
More examples of data analysis • Timing of first intercourse and marriage • Mother’s marital and cohabiting status at birth of child • Tobacco use • Breastfeeding, initiation and after select durations • Use of family planning services • Number of children fathered & total number expected • Attitude towards nonmarital childbearing
Percentage of men and women 15-44 years of age who agree or strongly agree with the statement, “It is all right for unmarried 18 year olds / 16 year olds to have sexual relations if they have strong affection for each other”: US, 2002 SOURCE: Martinez GM, Chandra A, Abma JC, Jones J, and Mosher WD. Fertility, Contraception, and Fatherhood: Data on Men and Women from Cycle 6 (2002) of the National Survey of Family Growth. Vital and Health Statistics. Series 23, No. 26. Hyattsville, MD: National Center for Health Statistics. 2006.
Percentage of never married 15-19 year olds who were sexually experienced, by age: US, 1995 and 2002 Females Males SOURCE: Abma JC, Martinez GM, Mosher WD, and Dawson BS. Teenagers in the United States: SexualActivity, Contraceptive Use, and Childbearing, 2002. Vital and Health Statistics. Series 23, No. 24. Hyattsville, MD: National Center for Health Statistics. 2004.
Percent distribution of parents' marital or cohabiting status at the time their first child was born, by Hispanic origin and race: United States, 2002 Note: Based on independent samples of men and women 15-44 years of age. Source: Martinez, GM, Chandra, A, Abma, JC, Jones, J, and Mosher WD Fertility, Contraception, and Fatherhood: Data on Men and Women from the 2002 National Survey of Family Growth. National Center for Health Statistics. Vital Health Stat 23(26). 2006.
Percent of babies breastfed at all: single births 1990-93 and 1997-2000 SOURCE: Chandra A. New Data on Breastfeeding. DataSpeak Web Conference, May 11, 2005. Data from NSFG Cycles 5 and 6.
Use of Family Planning or Medical Services by Women 15-44 in Past Year: US, 2002 Percent SOURCE: Chandra A, Martinez GM,Mosher, WD Abma JC, Jones, J. Fertility, Family Planning, and Reproductive Health of U.S. Women: Data from the 2002 National Survey of Family Growth. Vital & Health Statistics. Series 23, Number 25. Dec 2005. Hyattsville, MD: National Center for Health Statistics.
Percentage of men 15-44 years of age whose first child was born before they were 20 years old, by Hispanic origin and race: United States, 2002 SOURCE: Martinez GM, Chandra A, Abma JC, Jones J, Mosher WD. Fertility, Contraception, and Fatherhood: Data on Men and Women from Cycle 6 (2002) of the 2002 National Survey of Family Growth. Vital and Health Statistics. Series 23, Number 26. Hyattsville, MD: National Center for Health Statistics. 2006.
Percentage of fathers 15-44 years of age who did the specified activity several times a week or more in the last 4 weeks with their children under 5 years old, by whether or not they lived with their children: US, 2002 SOURCE: Martinez GM, Chandra A, Abma JC, Jones J, Mosher WD. Fertility, Contraception, and Fatherhood: Data on Men and Women from Cycle 6 (2002) of the National Survey of Family Growth. Vital and Health Statistics. Series 23, Number 26. Hyattsville, MD: National Center for Health Statistics. 2006.
Selected NSFG 2002 content:Data collected in self-administered section (ACASI) • Height and weight • Alcohol, tobacco & drug use in last 12 months • Non-voluntary sex (18-44 only) • Sexual orientation and attraction • STIs – ever diagnosed or treated in the last 12 months • Pregnancies had (women) or fathered (men) • Types of sexual contact
Percent of males and females 25-44 years of age reporting each type of sexual contact, as reported in ACASI: US, 2002 SOURCE: Mosher, WD, A Chandra, & J Jones.Sexual Behavior and Selected Health Measures: Men and Women 15-44 Years of Age: United States, 2002. Sep 2005. Hyattsville, MD: National Center for Health Statistics Advance Data Number 362.
Percent of sexually experienced women 18-44 years of age whose first intercourse was not voluntary 20 10 9 6 5 4 3 SOURCE: Chandra A, Martinez GM,Mosher, WD Abma JC, Jones, J. Fertility, Family Planning, and Reproductive Health of U.S. Women: Data from the 2002 National Survey of Family Growth. Vital & Health Statistics Series 23, Number 25. Dec 2005. Hyattsville, MD: National Center for Health Statistics.
Selected NSFG 2002 content:Self-administered section - HIV & STDrisk Focus on behaviors in last year • Drug-related risk: • Injection of non-prescription drugs • Use of illicit drugs • Sex-related risk: • If male: sexual contact with other males;If female: sex with men who have had sex with men • Sex with an HIV-positive partner • Sex with an IV drug user • Number of sexual partners in last year • Exchange of sex for drugs or money • Testing or treatment for sexually transmitted infection
Percent tested for HIV in last year by number of opposite-sex partners in the last year: US, 2002 SOURCE: Anderson JE, A Chandra, & WD Mosher. HIV Testing in the United States. Nov 2005. Hyattsville, MD: National Center for Health Statistics, Advance Data Number 363.
Percent of men and women 20-44 years of age who are at increased risk of HIV due to their recent sexual or drug use behavior or as indicated by recent STD treatment, by poverty status: United States, 2002 Source: Anderson JE, Mosher WM, and Chandra A. (2006) Measuring HIV Risk in the US Population aged 15-44: Results from Cycle 6 of the National Survey of Family Growth. Advance Data from Vital and Health Statistics, No. 377, October 2006. Hyattsville, MD: National Center for Health Statistics.
Available NSFG data files • Public use files for Cycles 1 thru 6 are available free on CD-ROM: NSFG@cdc.gov • ACASI data files—which contain the sexual behavior data—are available on request. Application is on the web site. The file is free. • Contextual data file can be used thru NCHS Research Data Center. 1,000 variables at state, county, tract, block group are available. For a complete listing, see the NSFG web page. • You can also add your own variables.
Cycle 7 – start of continuous interviewing for NSFG • Interviewing began June 2006 • Expected 4400 interviews per year • Why continuous interviewing? • More timely and cost effective ability to supply data on: • HPV vaccine • New contraceptive methods on the market • Emergency contraception (ever, last 12 months, provider) • Assessing populations at risk for HIV/STD and Unintended pregnancy
How to contact us … nsfg@cdc.gov 301-458-4222 (leave message) National Survey of Family Growth National Center for Health Statistics 3311 Toledo Road, Room 7318 Hyattsville, MD. 20782 NSFG team Joyce Abma, PhD Anjani Chandra, PhD Jo Jones, PhD Gladys Martinez, PhD Brittany McGill, MPP Bill Mosher, PhD