Download
1 / 20
200 likes | 303 Views
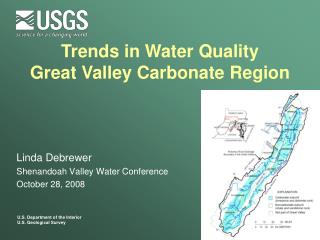
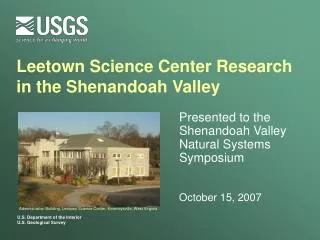
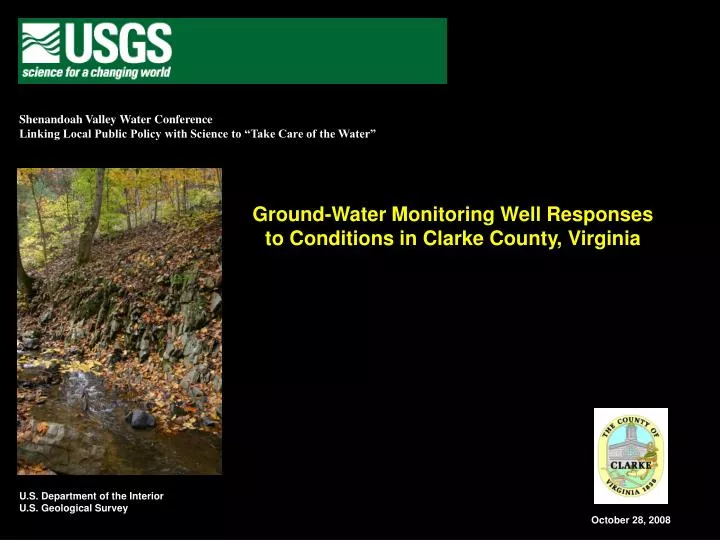
Shenandoah Valley Water Conference Linking Local Public Policy with Science to “Take Care of the Water”. Ground-Water Monitoring Well Responses to Conditions in Clarke County, Virginia. U.S. Department of the Interior U.S. Geological Survey. October 28, 2008. ROCK TYPE. Siliciclastic

E N D
Shenandoah Valley Water Conference Linking Local Public Policy with Science to “Take Care of the Water” Ground-Water Monitoring Well Responses to Conditions in Clarke County, Virginia U.S. Department of the Interior U.S. Geological Survey October 28, 2008
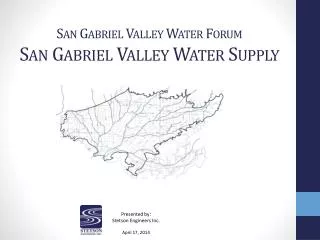
ROCK TYPE Siliciclastic Carbonate Crystalline Generalized hydrogeologic units map of Clarke County, Va. Geology from Davis and others (2001), Rader and Gathright (2001), Rader and others (2001; 2003), and Virginia Division of Mineral Resources (2003). Base from Clarke County 1:2,400 scale Digital Line Graph data Projection Virginia State Plane North, FIPS 4501 North American Datum 1983 Central Meridian 78o30’W
Ground-water flow system Clarke County Clarke County Modified from Harris and others (1994) and Davis and others (2001)
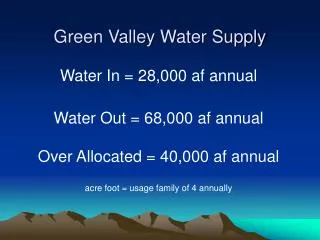
Minimum-Maximum Water-Level Difference Period of Record October 2002 to July 2008
Average Annual Precipitation for Clarke County, Va. Parameter-elevation regressions on independent slopes model (PRISM) grid of average annual precipitation for Clarke County, Va. The normal values are based on the National Weather Service’s current normal climatological period from 1971 to 2000. Base from Clarke County 1:2,400 scale Digital Line Graph data Projection Virginia State Plane North, FIPS 4501 North American Datum 1983 Central Meridian 78o30’W
8 445851 Mt. Weather Elevation: 1,720 ft AMSL 6 MONTHLY AVERAGE 4 2 0 AVERAGE MONTHLY PRECIPITATION, IN INCHES 8 449186 Winchester 7 SE Elevation: 680 ft AMSL 6 4 MONTHLY AVERAGE 2 0 JAN JAN FEB FEB MAR MAR APR APR MAY MAY JUN JUN JUL JUL AUG AUG SEP SEP OCT OCT NOV NOV DEC DEC MONTH The normal values are based on the National Weather Service’s current normal climatological period from 1971 to 2000. Average Monthly Precipitation near Clarke County, Va. JAN FEB MAR APR Primary Ground-Water Recharge Months NOV DEC Soil-Moisture Deficit Replenishment Months
70 60 50 40 30 20 10 0 Relation between Ground-Water and Surface-Water USGS 01616100 Dry Marsh Run near Berryville, Va. ANNUAL RATES, IN INCHES PER YEAR 2001 2002 2003 2004 2005 YEAR Precipitation at Winchester 7 SE Station 449186 Mean streamflow Mean base flow Percentage of the ground-water component of mean streamflow 90%
Drought Conditions 2002 Wet Conditions 1996 Drought Impacts Area along Rt. 620 where ground water overflows along bedding and joints (darker tones) in the carbonate rock. Strike of the bedding is to the northeast. North is top of photograph.
Drought Conditions 2002 Wet Conditions 1996 Drought Impacts Area along Rt. 7 and west of Berryville where Dry Marsh Run flows from spring 46XS 8 (red dot) during wet conditions into a swallet hole (arrow) and wetland area (darker tones) shaped like a wishbone to the north of the arrow. During dry or drought conditions spring 46XS 8 is frequently dry. During wet conditions, flows range from less than 1 cfs to 4.5 cfs. North is top of photographs.
Drought Impacts—Dry Stream Segments Area along Rt. 7 and west of Berryville where Dry Marsh Run flows from spring 46XS 8 (red dot) during wet conditions into a swallet hole (arrow) and wetland area (darker tones) shaped like a wishbone to the north of the arrow. During dry or drought conditions spring 46XS 8 is frequently dry. During wet conditions, flows range from less than 1 cfs to 4.5 cfs. North is top of photographs.
1997 1999 2005 1998 2000 2001 2002 2003 2004 2006 1990 1991 1996 2007 2008 1988 1989 1992 1993 1994 1995 CALENDAR YEAR Drought Impacts—Well 46W175 Water-Level Distribution 20 25 30 DAILY WATER LEVEL, IN FEET BELOW LAND SURFACE 35 40 45 50
10 5 0 -5 -10 Drought Impacts—Well 46W175 & El Nino/La Nina Episodes ~ El Nino DEVIATION FROM OCEANIC NINO INDEX, IN DEGREES CELSIUS DAILY MAXIMUM WATER LEVEL, IN FEET BELOW LAND SURFACE 46W175 ~ La Nina 1995 2000 2005 2010