Download
1 / 11
110 likes | 201 Views
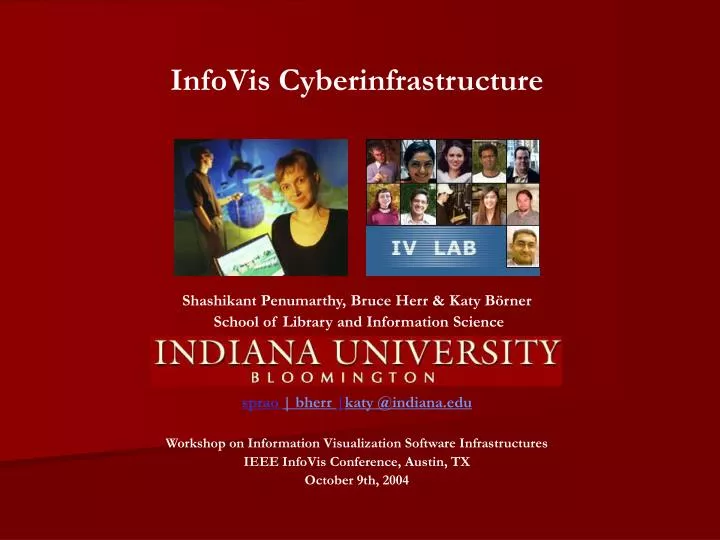
InfoVis Cyberinfrastructure Shashikant Penumarthy, Bruce Herr & Katy Börner School of Library and Information Science sprao | bherr | katy @indiana.edu Workshop on Information Visualization Software Infrastructures IEEE InfoVis Conference, Austin, TX October 9th, 2004.

E N D
InfoVis Cyberinfrastructure Shashikant Penumarthy, Bruce Herr & Katy Börner School of Library and Information Science sprao | bherr |katy @indiana.edu Workshop on Information Visualization Software Infrastructures IEEE InfoVis Conference, Austin, TX October 9th, 2004
InfoVis Cyberinfrastructure (IVC) Software Framework II.1) Project Name and Web Address Information Visualization Cyberinfrastructure (IVC) Software Frameworkhttp://iv.slis.indiana.edu/sw/http://sourceforge.net/projects/ivc/ II.2) Core Team Members Developer, Shashikant Penumarthy, SLIS, Indiana University sprao@indiana.edu Developer, Bruce Herr, CS, Indiana University bherr@indiana.edu Project Manager, Katy Börner, SLIS, Indiana University katy@indiana.edu II.3) Project Start Date May 11, 2004. The IVC Software Framework supersedes the original Information Visualization Repository that we started in 2000. IVC Software Framework, Workshop on Information Visualization Software Infrastructures, 2004.
II.4) Targeted User Group • Researchers interested in the generation of Knowledge Domain Visualizations (KDVis) -- see also PNAS 101 (Suppl. 1) Apr 6, 2004 on 'Mapping Knowledge Domains'. • Researchers and educators to run and compare commonly used data cleaning, analysis, modeling, visualization and interactivity algorithms. • Algorithm developers interested in using the IVC as a medium for making new algorithms freely available. II.5) Supported User Tasks • Serialization of algorithms, e.g., network extraction (e.g., co-author networks from publication data) -> network analysis (e.g., identification of hubs) -> network layout (e.g., using Kamada Kawai, hubs are visually distinct) -> network interaction (e.g., zoom). • Algorithm comparison, e.g., display a directory hierarchy using a JTree, a radial tree, a hyperbolic tree or a treemap layout, to determine the usability of (new) algorithms or to teach/learn the (dis)advantages of different algorithms. • Conversion between data types. (e.g., load a co-author matrix -> convert to graph -> prune/cluster the graph using an importance metric -> visualize/save resultant graph to disk.) IVC Software Framework, Workshop on Information Visualization Software Infrastructures, 2004.
IVC Software Framework, Workshop on Information Visualization Software Infrastructures, 2004.
http://vw.indiana. edu/aag05/
II.4) Targeted User Group • Researchers interested in the generation of Knowledge Domain Visualizations (KDVis) -- see also PNAS 101 (Suppl. 1) Apr 6, 2004 on 'Mapping Knowledge Domains'. • Researchers and educators to run and compare commonly used data cleaning, analysis, modeling, visualization and interactivity algorithms. • Algorithm developers interested in using the IVC as a medium for making new algorithms freely available. II.5) Supported User Tasks • Serialization of algorithms, e.g., network extraction (e.g., co-author networks from publication data) -> network analysis (e.g., identification of hubs) -> network layout (e.g., using Kamada Kawai, hubs are visually distinct) -> network interaction (e.g., zoom). • Algorithm comparison, e.g., display a directory hierarchy using a JTree, a radial tree, a hyperbolic tree or a treemap layout, to determine the usability of (new) algorithms or to teach/learn the (dis)advantages of different algorithms. • Conversion between data types. (e.g., load a co-author matrix -> convert to graph -> prune/cluster the graph using an importance metric -> visualize/save resultant graph to disk.) IVC Software Framework, Workshop on Information Visualization Software Infrastructures, 2004.
II.6) Major Features of the System Architecture The IVC is a pluggable framework. Each software component part of the IVC can be “plugged-in” or “unplugged” as needed. This way, new kinds of algorithms, but also new data structures, new persistence methods, new look and feels for the interface and even entire toolkits can be easily integrated. The IVC framework can be divided into the following components: • IVC Core – This is the manager of all system components and resources. It comprises the registries, the initializer and the IVC class. • Data Models – All supported data structures fall into this category. Support for data models is determined completely by the installed plug-ins. • Persistence – This consists of pluggable components each of which provides ways to store data to disk or other locations such as a database and to load data into the data models. • Graphical User Interface (GUI) – The menu driven front-end for the system. • Plug-Ins – The analysis, modeling and visualization algorithms or toolkits. • Scheduler - Enables a user to set up a sequence of analyses or set up conditional execution pipelines. • Logger - Logs user actions so that one can go back and see the sequence of steps one took to get to a particular result starting from a particular dataset. IVC Software Framework, Workshop on Information Visualization Software Infrastructures, 2004.
II.6) Major Features of the System Architecture IVC Software Framework, Workshop on Information Visualization Software Infrastructures, 2004.
II.7) Algorithms Provided The following algorithms are currently available: Preprocessing: Stop Word Removal, Porter Stemmer, Term Document Matrix.Modeling: Random Networks, Watts Strogatz, Barabasi Albert models, P2P Networks, (CAN, CHORD, Pru, Hypergrid),TARLAnalysis: Burst Detection, Betweenness Centrality Clustering, ABSURDIST (concept-matching)Search: Random-Walk, BFS, Search in P2P NetworksNetwork Layouts: Fruchterman-Rheingold, Kamada-Kawai, Spring, Circle.Interaction: Distortion, FisheyeMenu, ZoomingPan (Prefuse demos)Toolkits: AW Toolkit (Analysis and Visualization of Virtual World Behaviour), Network Analysis Toolkit The following algorithms are currently being integrated:Analysis: Ward Clustering, Path Finder Network Scaling, Similarity Flooding, Latent Semantic Analysis, Vector Space Model, SimVis (Matrix visualization)Visualization: BurstVis (bursty events over time), Radial Tree, Hyperbolic Tree, Treemap. IVC Software Framework, Workshop on Information Visualization Software Infrastructures, 2004.
Demo IVC Software Framework, Workshop on Information Visualization Software Infrastructures, 2004.
Part III: Main interest in participating in the workshop • Determine the feasibility of combining efforts to create a common, shared IV infrastructure as opposed to 100s of underfunded or proprietary toolkits, platforms and frameworks. • Scouring for ideas for a common data protocol for communication between plugins. • Eliciting feedback about the IVC software architecture with regard to extensibility and ensuring that it is future-proof. IVC Software Framework, Workshop on Information Visualization Software Infrastructures, 2004.