Download
1 / 56
560 likes | 765 Views
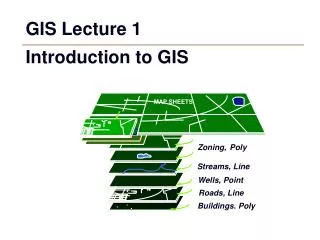
GIS Lecture 10 Extensions. Outline. Extensions Overview Free Add On Applications Network Analyst Spatial Analyst 3D Analyst Community Visualization tools TerraSim Keyhole Extensions Review. ArcGIS Extensions. http://www.esri.com/software/arcgis/arcgisxtensions/

E N D
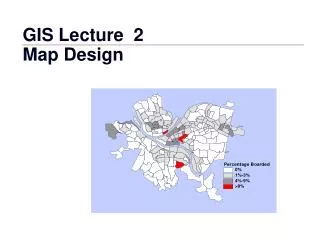
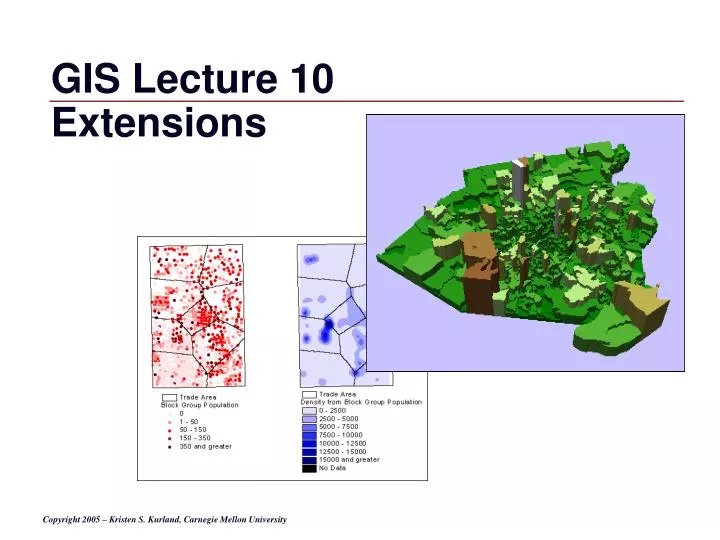
GIS Lecture 10 Extensions
Outline • Extensions Overview • Free Add On Applications • Network Analyst • Spatial Analyst • 3D Analyst • Community Visualization tools • TerraSim • Keyhole • Extensions Review
ArcGIS Extensions • http://www.esri.com/software/arcgis/arcgisxtensions/ The following ArcGIS Extension products add specialized tools and functionality to ArcView, ArcEditor and ArcInfo. • 3D Analyst • Business Analyst • Geostatistical Analyst • Military Analyst • Publisher • Schematics • Spatial Analyst • StreetMap • Survey Analyst • Tracking Analyst • ArcPress • ArcScan • Job Tracking • MrSID Encoder
Free ArcGIS Add-Ons • ArcWeb Toolbar • Tablet PC Support for ArcGIS • ArcMap GPS Support • Districting for ArcGIS
Network Analyst • Solves a variety of problems based on geographic networks including: • Most efficient travel routes • Travel directions • Closest emergency vehicle or service facility to an incident • Service areas or sales territories based on travel time
Delivery Route • - This path represents a delivery truck route. • - With the Network Analyst, the dispatcher can define a route that with stop at each restaurant in the most efficient order and return to the warehouse.
Shortest and Fastest Path • -This path represents the shortest linear distance between the two locations. • - This path represents the fastest path between the same two locations used in the previous example. • - Fastest paths are based on time. You can use any measure of time ( seconds, minutes, hours, etc.)
Service Areas • - Overlapping and nested service areas are individual polygons. • - This allows you to use ArcView's spatial analysis tools to determine which customers or how many customers are in each service area or if any customers are serviced by more than one site.
Areas within a Distance • This example shows which areas are within a 10 minute walking distance of different bus stops (service area and network) and which bus routes (find best route) are serviced by the stops.
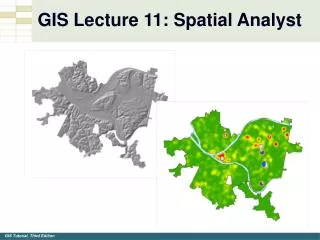
Spatial Analyst • Grid based layers • Geographic data to attempt to describe, simulate or predict a real-world problem or system • Creates continuous surfaces from scattered point features • Maps easy to read
Grid Layers • Divides geographic space into uniform blocks called cells • Every cell represents a certain specified portion of the earth, such as a square kilometer or square meter • Each cell is given a value that describes the site, such as elevation or landuse type
Wild Fire Predictions • Original wind direction grid. • Using Spatial Analyst, add 90 degrees to each cell value in the first grid to generate a second wind direction grid.
Soil Information • Farmers can determine the soil pH values
Hydrology Maps • Flow direction grid from an elevation grid • Hypothetical spill points, shown by white dots, on the elevation grid. Spatial Analyst uses the flow direction and elevation values to compute the contaminant's probable downhill path.
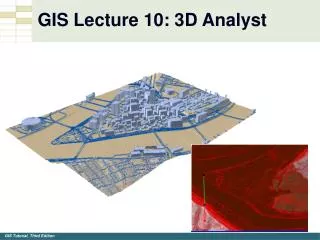
3D Analyst Overview • 3D Analyst Extension • Surfaces • Grids • TINS • 3D Shapefiles • 3D Scenes • Examples
Surface Model • A geographic surface, or surface model, represents a spatial quantity or phenomenon that can be measured continuously over some part of the earth • Terrain Elevations • DEM - Digital Elevation Model • DTM - Digital Terrain Model
Other Surface Examples Geographic phenomena - Soil type - Land cover - Temperature - Rainfall - Population density
Surface Model (Elevations) • Sample elevation points that can be used to generate a surface model. • A set of sample elevation points. Each point has x,y values and a z value, which defines its elevation.
Surface Model (Elevations) • A surface model generated from the points and displayed in 3D perspective.
Grids • A grid defines geographic space as a matrix of identically-sized square cells. • Each cell holds a numeric value that measures a geographic attribute (like elevation) for that unit of space. • When the grid is drawn as a map, cells are assigned colors according to their numeric values.
Grids • A grid divides geographic space into cells of equal size. Each cell stores a number that measures a geographic value at that location. In this case, the numbers reflect elevation in meters.
Grids • An elevation grid drawn in a view. The cell values are classified by numeric range and symbolized with different colors.
Grid Example • Proposed shopping center plan displayed on a graded elevation surface
TIN • (Triangulated Irregular Network) • A TIN is a data structure that defines geographic space as a set of contiguous, non-overlapping triangles, which vary in size and angular proportion.
TIN Structure • Defined by two elements: a set of input points with x,y, and z values, and a series of edges connecting these points to form triangles. • Each input point becomes the node of a triangle in the TIN structure, and the output is a continuous faceted surface of triangles.
TIN • The TIN structure, showing nodes (sample elevation points) and the triangles generated from them.
TIN Example • Santa Barbara elevation surface
3D Shapefiles • Displays discrete geographic features • Buildings • Rivers • Wells • Roads in 3D
3D Shapefiles • Attributes of a 2D shapefile • Attributes of a 3D shapefile
3D Contours • Mt. Saint Helens • Start with a 2D Contour Map
3D Contours • Surface layer created
Dynamic 3D Views • Perspective angle in 3D Scene set at 60°
Loading Extensions (3D Analyst) • Tools, Extensions… • Choose the 3D Analyst Extension
3D Scenes • A 3D scene is a three-dimensional viewing environment for spatial data.
Draping features to a 3D Model • Raster Images • Vector Features
Extruding Features • Based on 3D field • Buildings extruded from height or number of floors
Navigating Scenes • Set Observers and Targets • Flythrough
ArcGlobe • Fast Viewing of Large 3D Datasets
Other 3D Examples Analyzing Visibility • Locations from which observers can see • Red part of the line is a gap in the line of sight
Other 3D Examples • Steepest-path analysis • Flow of liquid from a certain point
Other 3D Examples • 3D Representation of Land Value Totals by Tax Map Grid, Concord, North Carolina, USA
Other 3D Examples • North Macadam Development Concept—Floor Area Ratio Massing Study, City of Portland Bureau of Planning • Results of the massing model were used to generate a series of three-dimensional perspectives from adjacent neighborhoods and scenic points to help illustrate what the district's build-out form could look like. In addition, a regional elevation model was used to assess the impact of development on the visibility of important landscape features. This information was used to help the city, property owners, and the public understand what would be allowed under the proposed plan.
Advanced Visualization Tools • Helps view, project, analyze, and understand potential alternatives and impacts via visual exploration and alternative scenarios • Experiments with hypothetical scenarios, challenge assumptions on the fly • Encourages participation and collaboration by engaging users and public audiences via visualization and interactive participation.
Community VIZ • Community VIZ http://www.communityviz.com
Criterion Planners • INDEX http://www.crit.com
TerraSim, Inc. • CMU Spin-off • TerraTools • 3D GIS Visualization Software • http://www.terrasim.com/ • One Gateway Center, Suite 2050420 Fort Duquesne Blvd.Pittsburgh, PA 15222 • (412) 232-3646(412) 232-3649 FAX