Download
1 / 27
280 likes | 385 Views
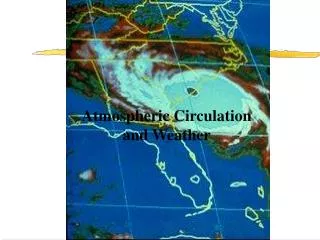
A Satellite View of Atmospheric Weather. GOES Infrared Imagery – January 2002. A Computer Simulation of the Ocean’s Internal Weather. Temperature at 100m Simulation duration: 1 year. Simulation courtesy of Mat Maltrud, Los Alamos National Laboratory. New Production: Fuel

E N D
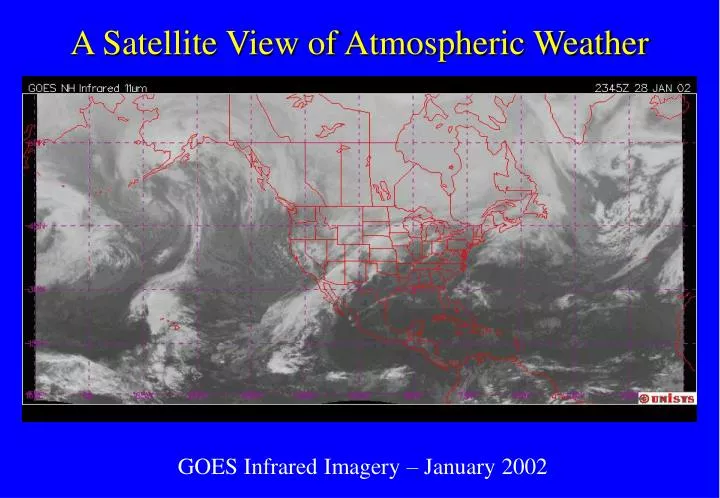
A Satellite View of Atmospheric Weather GOES Infrared Imagery – January 2002
A Computer Simulation of the Ocean’s Internal Weather Temperature at 100m Simulation duration: 1 year Simulation courtesy of Mat Maltrud, Los Alamos National Laboratory
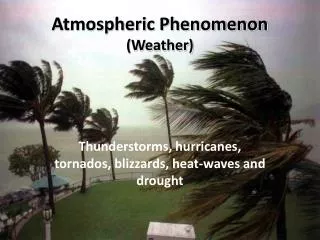
New Production: Fuel of the Biological Pump Phytoplankton Export flux
The Internal Weather of the Sea and its Influences on Ocean Biogeochemistry NABE BATS HOT ASPS EqPac AESOPS SeaWiFS NASA/GSFC 1. Variability in observations 2. Processes influence mean fluxes
North Atlantic Bloom Experiment CZCS April-June Composite Image by Gene Feldman
Impacts of eddies on the Spring Bloom in the North Atlantic 1. Heterogeneity in the “initial conditions” 2. Supply of nutrients for the post-bloom period 3. Mesoscale variability in particle flux to the deep sea (Newton et al. 1994)
Equatorial Pacific Process Study Chai et al. (1996)
A Line in the Sea – Yoder et al. (1994) Space Shuttle Atlantis R/V Thomas G. Thompson
A Line in the Sea Franks (1997) Archer et al. (1997)
“…the TIW resulted in a twofold increase in Chl… [and]…a fivefold increase in Chl biomass of diatoms…” “Two large organic carbon and biogenic SiO2 flux events… coincided with intense TIWs that passed through the region…” “A 60-70% increase in Chl… and a 400% increase in Chl contribution of diatoms was associated with…a TIW”
Arabian Sea Process Study Lee et al. (2000)
A coastal filament in the open ocean Filament: Highest biomass and productivity during SW monsoon (Barber et al. 2001) High diatom biomass (Latasa and Bidigare, 1998) Depletion of silicic acid (Morrison et al. 1998) Shifts in species composition associated with large export events (Honjo et al. 1999) Image courtesy of Bob Arnone
Antarctic Environment Southern Ocean Process Study Moore & Abbott (2000)
SeaSoar Survey of chlorophyll in a meander of the Antarctic Polar Front Horizontal Velocity Vertical Velocity Barth et al. (2001) UDUDU D Model simulation by Woods (1988) “Mesoscale upwelling and primary production”
Small scale variability in the Ross Sea Temp. pCO2 Hales, B., Sweeney, C. and T. Takahashi: “…resolution as fine as 15km misses 2/3 of the total variability in well-resolved fields…”
Time-series atHOT and BATS Steinberg et al. (2001)
An eddy event at HALE ALOHA in spring of 1997 Temperature Letelier et al. (2000) Threefold increase in 0-25m Chl Increase in 0-100m NO3 + NO2 of four orders of magnitude Twofold increase in diatom component of total Chl. Chl a
Influence of Mesoscale Eddies on New Production in the Sargasso Sea Flux estimates: Regional simulations (McG. et al., 1998) Satellite-based kinematics (Siegel et al., 1999) Basin-scale simulations (McG. et al., 2003) Observations: Moored time series (McNeil et al., 1999) Mesoscale surveys (McG. et al., 1999) Ocean color / SST imagery (McG. et al., 2001)
A Regional Hindcast Model Around BATS Valery Kosnyrev http://science.whoi.edu/users/mcgillic/tpd/tpd.html
Eddy Impacts on Phytoplankton Species Composition and Export Sweeney et al. (in press) Buesseler Th Flux Data BATS HPLC + Letelier et al. (1993) % total Chl Blue: Cyclones Red: Anticyclones Pink: Mode-water Eddies
An eddy-resolving model of the North Atlantic Temperature log (New Production) McGillicuddy, Anderson, Doney, Maltrud (2003)
New Production at BATS “Early JGOFS Era” “Late JGOFS Era” Observed Annual New Production = 0.5 mol N m-2 yr-1
Coarse (1.6º) Eddy-resolving (0.1º) Sea Surface Temperature log (New Production)
Conclusions Mesoscale motions create space/time heterogeneity in physical, biological, and chemical constituents in the water column. Mesoscale processes can drive significant fluxes that affect local, regional, and basin-scale biogeochemical budgets. A mechanism for modulation of the biological pump: Phys./chem. disturbance Physiological response Shifts in species composition Changes in export flux
An eddy-resolving model of the North Atlantic Temperature log (New Production)