Download
1 / 34
340 likes | 503 Views
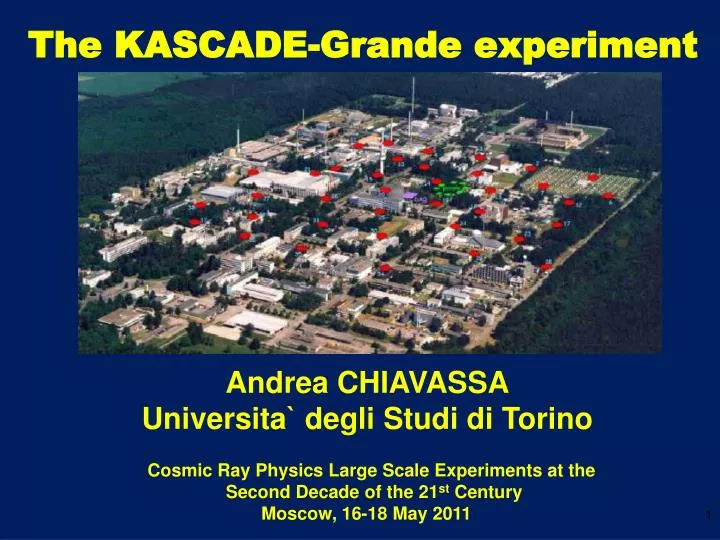
The KASCADE-Grande experiment. Andrea CHIAVASSA Universita` degli Studi di Torino. Cosmic Ray Physics Large Scale Experiments at the Second Decade of the 21 st Century Moscow, 16-18 May 2011. Motivations for the KASCADE-Grande experiment

E N D
The KASCADE-Grande experiment Andrea CHIAVASSA Universita` degli Studi di Torino Cosmic Ray Physics Large Scale Experiments at the Second Decade of the 21st Century Moscow, 16-18 May 2011
Motivations for the KASCADE-Grande experiment • The range 1016 – 1018 eV is crucial for different reasons: • - complete “knee” studies • investigate galactic-to-extragalactic transition • hadronic interactions • anisotropies 0.01 km2 1 km2 area required to detect ~100 events/year
KASCADE-Grande = KArlsruhe Shower Core and Array DEtector + Grande and LOPES Measurements of air showers in the energy range E0 = 100 TeV - 1 EeV
KASCADE-Grande detectors & observables • Shower core and arrival direction • Grande array • Shower Size (Nch number of charged particles) • Grande array • Fit NKG like ldf • m Size (Em>230 MeV) • KASCADE array m detectors • Fit Lagutin Function • m density & direction (Em>800 MeV) • Streamer Tubes
A standard event Apel et al. NIMA 620 (2010) 202-216 KASCADE-Grande efficiency DATA SIM 1016eV
Cross-check between KASCADE and Grande DATA ■ KASCADE stations ■ Grande stations Apel et al. NIMA 620 (2010) 202-216
Good agreement between the reconstruction accuracies of the 2 detectors DATA Arrival direction accuracy <1 Rayleigh fit Nch accuracy: systematics < 10% Core position accuracy: < 8m (NchG-NchK)/NchK ■Mean value □RMS Apel et al. NIMA 620 (2010) 202-216
Muon reconstruction (from simulation QGSjet II & FLUKA) (Nmrec-Nmtr)/Nmtr (Nmrec-Nmtr)/Nmtr < 20% SIMULATION After applying muon correction functions Apel et al. NIMA 620 (2010) 202-216
First Results: • All particle Energy • spectrum • Towards Mass Groups • spectra • 1173 days of effective DAQ time. • • Performance of reconstruction and detector is stable. • • θ < 40° • • 250 m < rKAS < 600 m
Reconstruction of the energy spectrum • We use three different methods: • Nch as observable • Nm as observable • Combination of Nch and Nm as observables • Cross check of reconstruction procedures • Cross check of systematic uncertainties • Test sensitivity to composition • Cross check of validity of hadronic interaction models If not explicitly mentioned in the following CORSIKA QGSjetII/FLUKA interaction model is used
Nch,mSpectra measured at different angles • Nch,m(q) Nch,m(qref) • CIC to correct for atmospheric • attenuation model independent E = a + blog10(Nch,m) Energy spectra model & composition dependent
log10(Nch/Nm )p,Fe=cp,Felog10Nch+dp,Fe Nch – Nm technique 5 angular bins treated independently log10(Nch/Nm) - log10(Nch/Nm)p k = log10(Nch/Nm)Fe - log10(Nch/Nm)p log10(Nch/Nm) SIM *error bars= RMS of distributions log10(Nch) SIM log10(E/GeV) log10Ep,Fe=ap,Felog10Nch+bp,Fe log10E=[ap+(aFe-a,p)]klog10(Nch)+[bp+(bFe-bp)k] log10(Nch)
Pro & cons of the methods • Nch or Nm alone: • Constant intensity cut method • • Correction for atmospheric attenuation is model independent • • Calibration function QGSjet II: shower size (Nch or Nμ ) vs E • • Composition dependent • Nch & Nm combined: • Composition independent • Correction for atmospheric attenuation is model dependent • Calibration function QGSjet II: Nch-Nm vs E
Check of resolutions and systematic errors using MC simulations Reconstructed/True flux fluxrec/fluxtrue Effect of Hadronic interaction model: EPOS data treated as exp. data and analyzed using QGSjet II SIM/QGSjet II log10(E/GeV)
Experimental data 0°<q<16.7° 16.7°<q<24.0° 24.0°<q<29.9° 29.9°<q<35.1° 35.1°<q<40.0° dN/dE x E2.5 (m-2s-1sr-1eV1.5) The measured fluxes are different EAS development in atmospehre not correctly described by the simulation? DATA DATA log10(E/GeV)
Comparing the 3 methods (dI/dE x E3) DATA Spectrum measured with the Nch-Nm technique lies in the allowed region by the CIC analysis performed both with Nch and with Nm
Residual plot DATA
Ftest = (2single power law / m) / (2function / n), with m,n = ndf single power-law, function Variance = 2n2(m+n-2) / m(n-2)2(n-4) Significance in units of the standard deviation = Ftest / √Variance 2single power law / ndf =2.97 2fermi / ndf =0.65 Ftest = 4.56 Variance = 0.51 Significance = 6.4 Fermi function 2single power law / ndf =2.97 22 power laws / ndf =0.49 Ftest = 6.09 Variance = 0.62 Significance = 7.7 g1=-3.0150.010 g2=-3.2440.077 2 power laws
Comparison with KASCADE & EAS-TOP ○ KASCADE QGSjet01 ▼ EAS-TOP ● KASCADE-Grande QGSjet2
The Energy spectrum shows structures. • The composition analysis is crucial to try to understand their origin. • The composition studies are approached with different techniques (all based on Nch-Nmobservables and QGSjet model) like we did for the Energy spectrum to have a cross check of the results and in order to study the systematic errors of each technique: • Nm/Nch distributions in bins of Nch (c2) • unfolding • k parameter • YCIC= logNm/logNch
The goal of the YCIC and “k parameter” algorithm is to separate the events into samples originated by primaries belonging to different “mass groups” • YCIC = log Nm(qref) / log Nch (qref) • k = (log(Nch/Nm) - log(Nch/Nm)p) / (log(Nch/Nm)Fe- log(Nch/Nm)p) • c2 and unfolding algorithm have the goal of measuring the spectra of single mass groups through statistical analysis of the two dimensional (Nch, Nm) spectra
Performances of the YCIC and “k parameter” algorithm. Calculated in the frame of CORSIKA full EAS simulation with QGSJet II interaction model. YCIC k paramater k Log(E/GeV) Log(E/GeV)
NY<0.84/NH & NY>0.84 /NFe YCIC vs. Primary Energy Vs. Distance from KASCADE
c2 methodNm/Nch distributions in bins of Nch intermediate
Nm/Nch distributions in bins of Nch • Fsim(i) = Sjaj fsim,j(i) Sjaj = 1 • c2 = Si (Fsim(i)-Fexp(i))2/s2(i) • It has already been shown that: • KG can separate three mass groups: • Light (H), Intermediate (He+C), Heavy (Si+Fe) • QGSJet II gives a good description of the measured Nm/Nch distributions in the whole Nch range • Light and Heavy mass groups are needed to describe the distributions measured in all Nch intervals
From aj to mass groups energy spectra • Analyzing the Nm/Nch distributions in the kth Nch interval we obtain the abundances aj(k) of different mass groups. • Nj(k) = aj(k) Nexp(k) • From Nj(k) we can calculate the flux in the kth Nch interval. • By a full simulation we convert Nch into primary energy. We calculate the differential energy fluxes of single mass group • Results heavily depend on the QGSjet II interaction model
Intermediate true Intermediate rec Test spectra of the three mass groups reconstructed with the c2 analysis. The results are not yet corrected for migration effects. No spectral breaks are introduced by the algorithm.
Unfolding Number of events Ni in the cells of the two dimensional spectra are given by: Where pn is the conditional probability of measuring an event in the Log Nm, log Nch cell if the shower was induced by a particle of type n and primary energy E
Conclusions • KASCADE-Grande operates in the 1016-1018eV energy range • <1° arrival direction, <10 m core position, ~15% Nch , >20% Nm resolutions • All particle Energy Spectrum • Agreement with KASCADE & EAS-TOP results at the threshold • Agreement between different reconstruction approaches • No single power law • Structures at the threshold and ~1017eV • Toward mass groups energy spectra • Resolve three mass groups • Mass group spectra will be soon presented
A feature like the one claimed by the GAMMA collaboration would have been detected. Even if broaden by KASCADE-Grande resolution and EAS development in atmosphere