Download
1 / 69
690 likes | 810 Views
Katrina Study (PKSRR) Workshop on Longitudinal Study of Natural Disasters Harvard Population Center June 11, 2011. Adversity and Resilience Study. Christina Paxson, Economics Princeton Mary C. Waters, Sociology Harvard Jean Rhodes, Clinical Psychology U Mass Boston

E N D
Katrina Study (PKSRR) Workshop on Longitudinal Study of Natural Disasters Harvard Population Center June 11, 2011
Adversity and Resilience Study Christina Paxson, Economics Princeton Mary C. Waters, Sociology Harvard Jean Rhodes, Clinical Psychology U Mass Boston Elizabeth Fussell, Sociology Washington State Cecelia Rouse, Economics Princeton Sarah Lowe, Psychology, U Mass Boston →Columbia Christian Chan, Psychology, U Mass Boston→ University of Hong Kong Corina Graif, Sociology, Harvard→ University of Michigan Nicole Deterding, Sociology, Harvard Margaret Willis, Sociology, Boston College Funded by NICHD, MacArthur Foundation, National Science Foundation Page 2
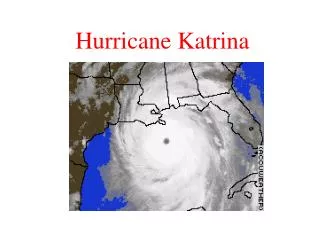
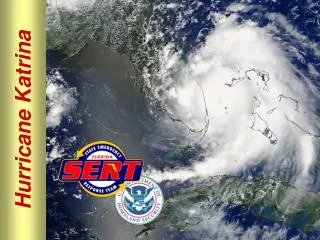
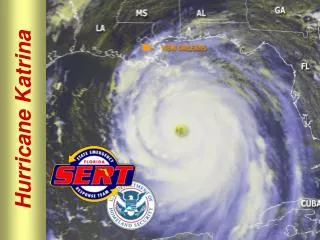
Hurricane Katrina 2005 Timeline Hurricane Katrina came into the Gulf on August 25, and increased to a Category 5 (winds peaking at 175 mph) by August 28. Mandatory evacuation of New Orleans ordered on August 28. Estimates are that ~1M (of ~1.2M) residents evacuated. Landfall in Louisiana: August 29. Category 3 with winds of ~125 mph. Extensive wind damage. 53 levee breaches produced extensive flooding: 80% of the city of New Orleans was flooded as of September 2, with water levels reaching 20 feet. It took weeks to pump the city out. Both a “natural” and “man made” disaster.
Hurricane Katrina Overall effects: Total costs estimated to be $81.2 billion. $30 billion in Federal aid. 1836 deaths, majority in Louisiana. 90,000 square miles declared a disaster area (Equal to the entire land mass of the UK) Displaced 650,000 people Destroyed 217,000 homes 60% of housing stock in New Orleans city was destroyed 30% of housing stock in New Orleans MSA was destroyed New Orleans City lost 29.1% of its population between 2000 and 2010. (Detroit lost 22.2%)
Opening Doors Study • Launched in 2003 by MDRC, MacArthur Network on Transition to Adulthood • Designed to test whether tuition supplements, enhanced student services or curricular enhancements could affect retention of students in community colleges. • Experiments conducted in 6 community colleges across 4 states. • Chris Paxson added questions on physical and mental health. • Louisiana Site—2 Community Colleges • Delgado Community College • Louisiana Technical College West Jefferson
Louisiana Opening Doors Study • Funding Came from Louisiana Department of Social Services and Louisiana Workforce Commission. TANF funds paid for the program but individuals did not need to qualify for TANF to be part of the study. • To qualify for the study students had to be • Between the ages of 18-34 • Parent of at least one dependent child under the age of 19 • Family income < 200% of poverty level • GED or High School Degree • No degree or occupational certificate from an accredited college or university program
The Opening Doors Sample N=1019, at baseline • 92% female • 85% black • 19% married • Average age 26 • 98% ever worked • 71% receiving government benefits. • 52% currently employed • 43% first in family to attend college • 69% had access to a working car • Average age of children 3 years • A disproportionate number come from the 9th Ward.
Baseline Survey 11/03-2/05 N=1019 12 Month Survey Sample A 12/04-8/05 N=492 Hurricane Katrina 8/25/05 Post Katrina Survey Sample A 5/06-2/07 N=402 Response Rate 82% Post Katrina 12 Month Sample B 3/06-2/07 N=309 Response Rate 58% Qualitative Interviews N=57 Second Follow Up Spring 09-10 Samples A and B 1019 eligible N=720 Response Rate 70.6% Genetic Study N=270 Qualitative Interviews N=63
Qualitative Interviews N=120 • First Wave Conducted after the 2006-2007 survey and linked to survey responses (57 interviews) • Second Wave Conducted after the 2009-2010 survey and linked to survey and previous qualitative responses. (63 interviews) • Equal number of people who were back in New Orleans, and who had relocated to Texas. • Covered Hurricane Experiences, life history, politics, intergroup relations, experiences of young adulthood, and questions about how their children are doing. • Transcribed and coded using Atlas Ti. • Interviews were linked to the longitudinal survey data to contextualize the interviews and to give a rich understanding of the trajectories of individuals.
Advantages of Our Sample • Most studies of disasters do not have data on people before the disaster. We had two waves of data on Sample A and one wave on Sample B before the hurricane. Our data included • physical and mental health • economic resources • social support • social trust • future aspirations and expectations • measures such as optimism, self esteem, confidence • Disasters have unequal impacts, generally exacerbating inequality and differentially affecting women, the poor, and racial minorities • The scope of Katrina makes it a very unusual and important disaster • Disasters are seldom studied longitudinally. We really do not know a lot about long term recovery.
College Re-enrollment Pet Loss Pre-disaster social support Child-related stressors Natural mentors Intimate relationships Interviewer race Decisions to evacuate Resilience Trajectories Children’s Functioning Combining Quantitative and Qualitative Methods Religion Barriers to Community College Completion Geographic Mobility Relocation Decision Making Neighborhood Attainment Employment Trajectories Changes in BMI Post Traumatic Growth Conservation of Resources Theory Transition to Adulthood Studies to Date
The Overall Picture • Psychological Resilience—defined as a return to pre-disaster levels of psychological functioning is the normal reaction to a disaster, even though it is remarkable. • Post traumatic growth is also widespread. Defined as subjective psychological gains directly related to the trauma they endured. • There is a lot of research on psychological resilience, very little on how social and economic resistance is related to it. • We know that community ties and social networks as well as socioeconomic resources are required for social well being. How does this affect recovery? • Recovery in New Orleans overall has been market driven, with federal money distributed on an individual basis. • New Orleans is recovering—but it is a changed city. Post Katrina it is smaller, older, more educated, less poor, fewer renters, fewer households with kids. New Orleans has its lowest poverty rate since 1979. • People who did not return are more likely to be poor, African American households with children. • Dilemma that they face: better individual opportunities outside New Orleans vs. the sense of community they had. • A false dilemma?
Katrina Traumas In the week after Hurricane Katrina hit was there a time when you:
Trauma Exposure 80.8% experienced home damage 32.1% experienced the death of a friend or relative (Paxson, et al. 2012.) Rise in domestic violence and stressed relationships with partners, even among people who had not experienced this before (Lowe, Rhodes, & Scoglio, in press).
Associations between Trauma and Outcomes Without Baseline Controls There are large and significant associations between housing or property loss and nearly every outcome. Individuals who reported large housing or property loss are 9.8% more likely to have K6>7—probable mild to serious mental illness), 7.8% more likely to have K6>12 serious mental illness, and 17.5% more likely to have likely PTSD. They are also more likely to report fair or poor health, and greater numbers of health conditions. Traumatic experiences associated with the hurricane are also significantly associated with nearly every health measure. For example, a person with the average number of traumas (3.14) is 5.3% more likely to have SMI than someone with no traumas and 18% more likely to have IES-R score>1.5 (likely PTSD)
How does the inclusion of pre-hurricane measures affect inferences? The inclusion of socio-demographic controls has remarkably little influence on the coefficients The associations between loss and trauma and health outcomes can be partially but not fully explained by pre-disaster health status. The inclusion of controls for pre K health reduces the coefficients for losses and trauma on MMI/SMI by approximately 20%. Coefficients for perceived stress and physical health generally decline as well. But the results for the two measures of PTSD symptoms change little with the inclusion of pre K health. (Controls include: age, race, #children, income, receive benefits, car, social support scale and number of months between hurricane and survey to capture systematic changes in health that occur over time.) Controls include: age, race, #children, income, receive benefits, car, social support scale and number of months between hurricane and survey to capture systematic changes in health that occur over time. Controls include: age, race, #children, income, receive benefits, car, social support scale and number of months between hurricane and survey to capture systematic changes in health that occur over time.
Conclusions on Health and Katrina9-19 months after the storm at First Follow Up Prevalence of serious mental illness doubled from 6.9% to `13.8% There was an increase in self reported poor or fair health, and both overweight and prevalence of having at least one diagnosed medical condition rose significantly. Nearly half (47.9%) of respondents exhibited probable PTSD post Katrina. Higher levels of loss and trauma were generally associated with worse health status, controlling for baseline socio-demographic and health measures. Higher baseline resources predicted less hurricane associated trauma, but the consequences of trauma and loss were similar regardless of baseline resources. For instance, if you had a working car and money for a hotel you were more likely to evacuate and experience less trauma, but if you did not evacuate those higher resources did not prevent you from experiencing negative consequences.
Five Years After 2009-2010 • Second follow up happened between March 2009 and August 2010 • Lived in 23 states • 16% of them were in their pre-hurricane homes. • What was the trajectory of mental health over the two survey points?
Trajectories of Recovery 4 years after the storm: PTSD Impact of Event Scale Revised IES-R>1.5 • Resistant (44%) • Did not show PTSD at either first or second follow-up • Recovered (23%) • Had high PTSD at first but not in second follow-up • Delayed (10%) • No symptoms at first follow-up, but present in • second follow-up • Chronic (23%) • High PTSD in both follow-ups The IES-R is a 22-item self-report scale that assesses distress produced by a specific traumatic event. It was developed to cover all DSM IV criteria for post-traumatic stress disorder (PTSD) The IES-R asks respondents to rate how much they were bothered by symptoms of distress about a traumatic event over the previous 7 days. Responses are coded from 0 (“never”) to 4 (“extremely”.) Scores are averaged over items, producing a total score that ranges from 0 to 4. Earlier research indicates that individuals with IES-R scores exceeding 1.5 are at high risk of having PTSD. 67% are doing well 33% are suffering
Trajectories of Recovery 4 years after: Psychological Distress (PD) K6 Scale >7 • Resistant (53%) • Did not show PD at either first or second follow-up • Recovered (17%) • Had high PD at first but not in second follow-up • Delayed (12%) • No symptoms at first follow-up, but present in • second follow-up • Chronic (18%) • High PD in both follow-ups . The K6 is a 6-item self-report scale that measures non-specific psychological distress and is used as a screener for anxiety and mood disorders. It is widely used in survey research and has good psychometric properties. The items in the scale ask about feelings such as “hopelessness” experienced during the past 30 days, with responses coded from 0 (“none of the time”) to 4 (“all of the time“.) 70% are doing well 30% are suffering
Three Measures of Trauma and Loss • Whether the respondent’s home experienced hurricane related damage. • Hurricane Trauma scale • 8 questions addressing experiences in the week following the hurricane • Whether a close friend or family member died as a result of the hurricane
What predicts high PTSD in 2009-2010? • Trauma and loss associated with the hurricane. • The effects of home damage and each additional trauma on the odds of having high PTSS increased from 2.48 to 4.76 and from 1.10 to 1.36, respectively, between the two surveys. • The effect of having a family member or friend die due to the hurricane decreased from 2.13 to 1.55. • Mental health problems before the hurricane increased the odds of high PTSD by 1.92 and 1.81 respectively at the first and second follow ups. • Only two sociodemographic factors predicted PTSD: • older women were more likely to experience it than younger women • Those who earned more before the hurricane were more likely to experience PTSD.
What predicts high Psychological Distress in 2009-2010? • Only traumas and death predict Psychological Distress, not home damage. • Those who had greater levels of social support at baseline were significantly less likely to show high psychological stress at either follow up.
Post traumatic growth5 subscales • Relating to Others • “I have a greater sense of closeness to others” • New Possibilities • “I developed new interests” • Personal Strength • “ I have a greater feeling of self reliance” • Spiritual Change • “I have a stronger religious faith” • Appreciation of life • “I have a greater appreciation for the value of my own life”
Post-traumatic growth • PTG was found to be strongly positively associated with symptoms of PTSD • Only those participants with high levels of PTSD at both time points maintained high levels of PTG over time (Lowe, Manove, & Rhodes, 2012).
Religion and PTG Pre-disaster religious involvement and faith were predictive of better post-disaster social resources which, in turn, were associated with lower levels of psychological distress (Chan, Perez, & Rhodes, 2010). Religious coping affected post-hurricane outcomes (Chan, Perez, & Rhodes, 2012).
Child Functioning Concerns about child welfare affected maternal mental health (Lowe, Chan, & Rhodes 2011). There were strong associations between child externalizing and internalizing symptoms and maternal psychological functioning (Lowe, Godoy, Carter, & Rhodes, 2012).
Mobility • Only 19% of our sample members reported no moves between baseline and all waves of the survey • 58% of participants had changed tracts between baseline and 2006 • 63% changed tracts between 2006 and 2009. • Individuals who were home owners and whose homes had not been flooded were more likely to return to NOLA (Paxson and Rouse, 2008).
Leaving New Orleans • SB How worried were you during that time when you were evacuating? • R I didn’t panic. I was kind of a little shaken up because this was all new to me. We were on a bus and tears just began to run out of my eyes because I was going to now an unfamiliar place that I have never been. I’ve been in New Orleans all my life. All my children, except for the little baby, were born and raised in New Orleans. My entire family, that is where we are from. New Orleans. So it just hurt me just to see the stage that the city was in. And to know that it would never be the same. Because while we were riding, I was just looking. Everything looks abandoned.
Figure 4: (A) Spatial distribution across the U.S. of New Orleans respondents one to two years after Katrina.
Distribution of individual applications for assistance from FEMA in 2007 at the Metro area level.
New Orleans has changed • July 2005 Population 455,188 • July 2009 Population 354,850 (78%) • City Schools are at 61% of their pre Katrina enrollment • Lower Ninth Ward (22%) • Metro Area is at 91% of its 2005 pre Katrina population • Average wages increased 14% between 2004 and 2008 • Latinos increased from 3% in 2000 to 4.7% in 2009 (probably undercounted) • Blacks have decreased from 67% in 2005 to 61% in 2009 • Violent crime and property crime have risen since Katrina
Arne Duncan, Secretary of Education “Let me be really honest. I think the best thing that happened to the education system in New Orleans was Hurricane Katrina. That education system was a disaster and it took Hurricane Katrina to wake up the community to say that “we have to do better”. And the progress that they’ve made in four years since the hurricane is unbelievable.” • January 29, 2010
Neighborhood CharacteristicsTract Level 2000 Census Data • The respondents are on average living in significantly better neighborhoods in terms of poverty and disadvantage. They are also living in significantly less segregated neighborhoods. • The new neighborhoods have less people in poverty (22% vs. 26%), less people with public assistance income (11% vs. 14%), less female headed households with children (40% vs. 46%). • They also have more college graduates (18% vs. 15%) and more professionals (16% vs. 12%). • These neighborhoods are more white (39% post K vs. 30% pre K), less black (48% vs. 63%) and nearly double the number of Hispanics (9% vs. 4%).
Census Tract Characteristics Pre and Post Katrina All Respondents N=867
Flooding and Moving, in 2006-07 • Of the non flooded respondents, those who move end up in slightly less poor neighborhoods. • Of the flooded respondents, they show considerable improvement in the quality of their neighborhoods. • Respondents who have moved outside of Louisiana are in much better neighborhoods.
Census Tract Characteristics Stayers vs. Movers For those who Experienced Flooding N=352
Census Tract Characteristics Pre and Post Katrina For those Moving outside Louisiana N=239