Download
1 / 18
180 likes | 297 Views
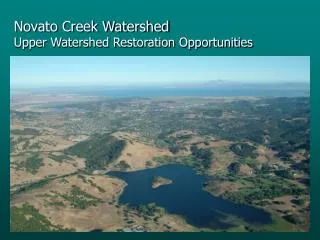
Bull Creek Watershed. Elaine B. Darby GIS – Fall 2005. Direction Provided by Dan Yates, Lower Colorado River Authority (LCRA). Lake Travis. Bull Creek Watershed. ERSI Imagery with NHD Streams. ArcGIS generated Hillshade Layer. Data Gathering & Processing. 10 m & 30 m DEM’s

E N D
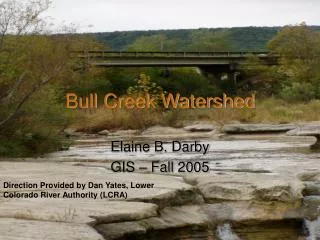
Bull Creek Watershed Elaine B. Darby GIS – Fall 2005 Direction Provided by Dan Yates, Lower Colorado River Authority (LCRA)
Lake Travis Bull Creek Watershed ERSI Imagery with NHD Streams
Data Gathering & Processing • 10 m & 30 m DEM’s • Downloaded from USGS Seamless server • 10 m DEM clipped for Bull Creek Watershed • 30 m DEM extent masked to 10 m DEM • NHD Streams & Waterbodies (1:24,000) • LCRA Hydromet Gauging Stations • NEXRAD Data – Nov, 2004
Bull Creek WatershedAgree DEM based on 10 m DEM & NHD Streams LCRA Hydromet Gauges
Watershed Delineation Area = 4.553 km^2 Area = 4.475 km^2 30 m DEM 51 Catchments 10 m DEM 52 Catchments
Area Analysis by DEM 1.7% Difference
Drainlines vs NHD StreamlinesNHD Streamlines - Blue Default Threshold = 0.81 km2 Threshold = 0.3 km2 Threshold = 0.2 km2
NEXRAD DataProvided by Dan Yates, LCRA • Data Source – National Weather Service – West Gulf River Forecast Center • NWS archive – http://dipper.nws.noaa.gov/hdsb/data/nexrad/wgrfc_stageiii.php • NCDC Java NEXRAD Tools – http://www.ncdc.noaa.gov/oa/radar/jnx
NEXRAD Data in GIS Old Spicewood Springs Road Photos from Bull Creek Foundation - www.bullcreek.net
Nexrad Grid – Nov. 14 – 17, 2004 Bull Creek Watershed 0 – 0.37 0.37 – 1.02 1.02-1.70 1.70 – 2.35 5.7 inches 2.35 – 2.94 2.94 – 3.53 3.53 – 4.12 4.12 – 4.70 4.70 – 5.29 5.29 – 5.99 5.99 – 6.84 6.84 – 7.91 7.91 – 9.14 9.14 – 10.6 10.6 – 13.6 6.0 inches
LCRA Hydromet Gauges Jollyville SW2 Bull Creek at 360 November 14 – 17 ,2005 Jollyville SW 2 5.80 inches Bull Creek at 360 6.12 inches
NEXRAD Stage III Data • Stage III – based on reflectivity measurements merged with surface rain gauge observations • Hourly precipitation – mm/hr – 4 km2 • Grid based data • Hydrologic Rainfall Analysis Project (HRAP) projection
NEXRAD Projections • Polar Stereographic map projection • Spherical Earth vs. Ellipsoidal • East-West distances distorted relative to North-South distances Ref.CRWR Online Report 95-3 A GIS Procedure for Merging NEXRAD Precipitation Data and Digital Elevation Models to Determine Rainfall-Runoff Modeling Parameters (1995) By Seann M Reed and David R. Maidment
Reed, Maidment (1999) & Xie, Zhou, et. al. (2005) Algorithms to perform coordinate transformations to mesh NEXRAD and DEM NCDC Java NEXRAD Tools Vector and Raster Grid Export Options NEXRAD GIS Large data sets – use algorithms
CONCLUSIONS • 10 m vs 30 m DEM – Catchment Areas • Very small difference for Bull Creek Watershed • No substantial difference in drainage area using 1% default threshold and ¼ % threshold • NEXRAD data • Integration into GIS can be done using transformation programs