Download
1 / 40
400 likes | 485 Views
Lecture 8. Topic Assignment Information Visualization – Origins Information Visualizer Visualization of Hierarchical Data. Assignment Instructions. Topics TBA Goal Identify “Top 25” Systems related to each Topic

E N D
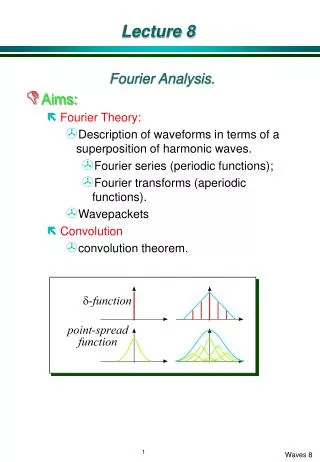
Lecture 8 • Topic Assignment • Information Visualization – Origins • Information Visualizer • Visualization of Hierarchical Data
Assignment Instructions • Topics • TBA • Goal • Identify “Top 25” Systems related to each Topic • Use searchCrystal to find systems www.searchcrystal.com and create free account for Full Version • Save different result lists • Compare and edit result lists to produce list of 25 systems • Email instructor final list from within searchCrystal Task: figure out how to prune result list in searchCrystal • Identify “Top 1”System for Each Topic • Categorize in terms • Perceptual Coding and Types of Interaction Used
Assignment Instructions • Create Presentation Powerpoint • Reflect on your Search Strategies • Effective Search Terms • Select “Best” System for each Topic Presentation Template http://www.scils.rutgers.edu/~aspoerri/Teaching/InfoVisOnline/PresentationTemplate.ppt – Provide Screenshots • Categorize using Perceptual Coding and Types of Interaction Toolbox • DUE = Monday Noon Week 11 • Host Powerpoint file online and email instructor URL
Recap – Information Visualization – “Toolbox” Perceptual Coding Interaction Information Density
Information Visualization – Origins • 1 Thought Leaders • Bertin, French cartographer, "The Semiology of Graphics (1967/1983) • Tufte (1983) emphasizes maximizing the density of useful information • 2 Statistical Visualization • Tukey (1977) “Exploratory Data Analysis”: rapid statistical insight into data • Cleveland and McGilll (1988) "Dynamic Graphics for Statistics“ • Analysis of multi–dimensional, multi–variable data • 3 Scientific Visualization • Satellites sending large quantities of data how to better understand it? • 4 Computer Graphics and Artificial Intelligence • Mackinlay (1986) formalized Bertin's design theory; added psychophysical data, and used to generate automatic design of data • 5 User Interface and Human Computer Interaction • Card, Robertson & Mackinlay (1989) coined “Information Visualization” and used animation and distortion to interact with large data sets in a system called the “Information Visualizer”
SeeSoft – Software Visualization Linked Displays Line = single line of source code and its length Color = different properties
Information Retrieval Need for Low-Cost, Instant Access of Objects in Use
Information Retrieval Low-Cost Information Workspace • Lower Cost of Info Access • Large Workspace • Rooms • 3D and Animation • Agents: delegate workload • Search • Organize Cluster agent • Interacting Interactive Objs • Real-Time Interaction • Rapid Interaction tuned to Human Constants • Visual Abstractions • Cone Tree for hierarchies • Perspective Wall for linear structures
Information Visualizer – Summary • Reduce Information Access Costs • Increase Screen Space Rooms Create Visual Abstractions ConeTree PerspectiveWall • Increase Information Density 3Dand Animation • Overload Potential • Create “Focus + Context” display with Fisheye Distortion • Logarithmic Animation to rapidly move Object into Focus • Object Constancy • Shift Cognitive Load to Perceptual System • Tune System Response Rates to “Human Constants” • 0.1 second, 1 second, 10 seconds Cognitive Co-Processor
Recap – Interaction – Mappings + Timings • Mapping Data to Visual Form • Variables Mapped to“Visual Display” • Variables Mapped to“Controls” • “Visual Display” and “Controls”Linked • Interaction Responsiveness “0.1” second • Perception of Motion • Perception of Cause & Effect “1.0” second Status Feedback “10” seconds • Point & click, parallel requests
Dynamic Queries & Starfields Two Most Important Variables Mapped to “Scatterplot” Other Variables Mapped to “Controls” “Visual Display” and “Controls” Linked
Dynamic Queries & Starfields Download Video(… will take a while) or http://www.scils.rutgers.edu/~aspoerri/Teaching/InfoVisResources/videos/ and right click on “filmFinder.mpeg” and save
Dynamic Queries & Starfields • Which Pre–attentive, Early Visual Processes Used? • Motion, Position, Color, (Size) • How to choose two dimensions of Starfield? • “Encode more important information more effectively” • Choose two variables of most interest / importance
Dynamic Queries & Starfields • Advantages of Dynamic Queries over traditional query language such as SQL • Make Query Formulation Easy = Interact with Sliders and Visual Objects (SQL = Structured Query Language is difficult to master) • Support Rapid, Incremental and Reversible Exploration • Shift Cognitive Load to Perceptual System • Selection by Pointing • Tight Coupling of Interface Components • Link and Continuously Update the displays showing specific “states” of software (“page number” and “scrollbar position” linked) Linked Display and Controls • Immediate Visual Feedback • Avoid “Null set” by having current selection limit further query refinement • Progressive Query Refinement • Details on Demand
Starfields Perceptual Coding Interaction
Hierarchical Information • Pervasive • File / Directory systems on computers • Classifications / Taxonomies / Controlled Vocabularies • Software Menu structure • Organization charts • … • Main Visualization Schemes • Indented Outlines • Good for Searching Bad for Structure • Node-Link Trees • Top-to-Bottom Layout • 2D • 3D : ConeTree • Radial Layout • 2D : SunBurst, Hyperbolic Trees • 3D : H3 & Walrus • Space-Filling Treemaps
Hierarchical Data – Traditional Node-Link Layout Allocate Space proportional to # of Children at Different Levels
Traditional Node-Link Layout SpaceTree • HCI Lab – University of Marylandhttp://www.cs.umd.edu/hcil/spacetree/ Download Video(… will take a while) or http://www.scils.rutgers.edu/~aspoerri/Teaching/InfoVisResources/videos/ and right click on “orgchart.avi” and save
Positive Higher Information Density Smooth animation Negative Occlusion Non-trivial to implement Requires horsepower 3D ConeTree • 3D used to increase Information Density • Children laid out in a cylinder “below” parent
Nested Tree-Map Treemaps – Nested vs. Non-nested Non-nested Tree-Map
Treemaps – Examples • SmartMoneyhttp://www.smartmoney.com/marketmap/ • The Hive Group • http://www.hivegroup.com/solutions/demos/stocks.html • Newsmap • http://www.marumushi.com/apps/newsmap/newsmap.cfm
Treemaps – Video & Demos • Treemap 4.0 Video • Video: http://www.cs.umd.edu/hcil/treemap/doc4.0/Video/TotalWithBuffer.html • Treemap Demo • Applet: http://www.cs.umd.edu/hcil/treemap/applet/index.shtml • Download: http://www.cs.umd.edu/hcil/treemap/demos/ • Launch Demo • File > NBA Statistics • “Main” Tab: choose “Squarified” • Examine “Label” Tab • Task • Find 3 top Players who have played at least 80 games and scored the highest “Points per Game” • History of Treemaps http://www.cs.umd.edu/hcil/treemap-history/index.shtml
Treemaps • Which Problem do Treemaps aim to address? • Visualize hierarchical structure as well as content of (atom) nodes • What are Treemaps’ main design goals? • Space–filling(High Data / Ink Ratio) • “Structure” is represented using Enclosure / Containment • “Content” is represented using Area • Pre–attentive, Early Visual Processes Used? • Position, Size = Area, Color and Containment
Non-nested Nested Treemap Data = Hierarchy Perceptual Coding Interaction
Which has bigger area? Non-nested Nested Questions – Treemaps • What are the strength’s of Treemaps?What are the issues / weaknesses of Treemaps? What are the visual properties that make them easier or harder to use? • Easy to identify “Largest” because of size = area coding • Easy to identify “Type” of atom node because of color coding • Structure can be difficult infer: borders help, but consumes space • “Long-Thin Aspect Ratio” issue and “Area” can be difficult to estimate • When is a nested display more effective than a non-nested display? • To make structure easier to see
Squarified Unordered best aspect ratios medium stability Slice-and-dice Ordered, very bad aspect ratios stable Treemaps – Other Layout Algorithms • Hard to Improve Aspect Ratio and Preserve Ordering
Treemaps – 1,000,000 items http://www.cs.umd.edu/hcil/VisuMillion/
Treemaps – Shading Visualization Group - Technical University of Eindhovenhttp://www.win.tue.nl/vis/ • Borderless Treemap difficult to see structure of hierarchy • CushionTreemap SequoiaView
Treemaps – PhotoMesa • Quantum Treemaps / Bubblemaps for a Zoomable Image Browserby B. B. Bedersonhttp://www.cs.umd.edu/hcil/photomesa/ Download Video(… will take a while) or http://www.scils.rutgers.edu/~aspoerri/Teaching/InfoVisResources/videos/ and right click on “photoMesa.mpeg” and save
Hierarchical Data – Radial Space-Filling SunBurst http://www.cc.gatech.edu/gvu/ii/sunburst/
Botanical Visualization of Huge Hierarchies Visualization Group - Technical University of Eindhovenhttp://www.win.tue.nl/vis/
Traditional Treemap Botanical SunTree ConeTree Hierarchical Information – Recap