Download
1 / 21
210 likes | 379 Views
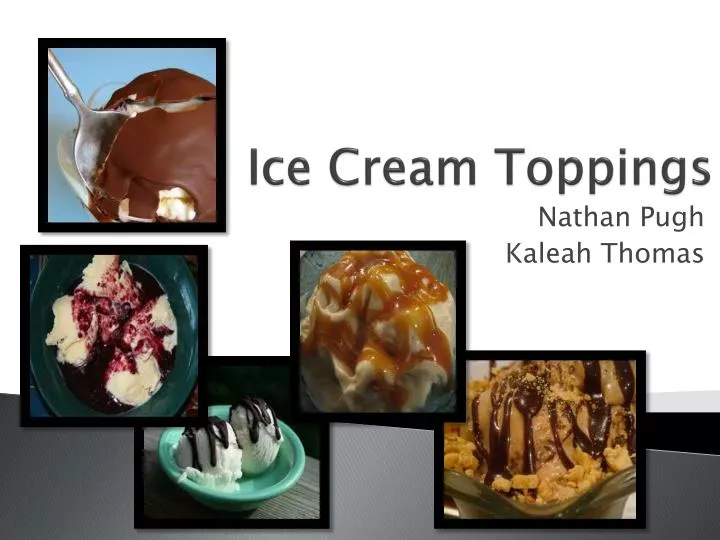
Ice Cream Toppings. Nathan Pugh Kaleah Thomas. Demographic trends have not changed much from 2003 to 2007. Demographics Role Assessment Strategy Recommendations. Nielsen Answers Ad Hoc Demo. Demographic difference by brand. Demographics Role Assessment Strategy Recommendations.

E N D
Ice Cream Toppings Nathan Pugh Kaleah Thomas
Demographic trends have not changed much from 2003 to 2007 Demographics Role Assessment Strategy Recommendations Nielsen Answers Ad Hoc Demo
Demographic difference by brand Demographics Role Assessment Strategy Recommendations CTL BRAND HSY LITE SMUCKERS Nielsen Answers Ad Hoc Demo
Private Label change in trends Demographics Role Assessment Strategy Recommendations Nielsen Answers Ad Hoc Demo
Product Snapshot Nielsen Answers Product Snapshot
Hershey brand owns 70% of market Demographics Role Assessment Strategy Recommendations Total Chocolate Syrup Market: $181.3 M Nielsen Answers Ad Hoc Base
Syrup Toppings penetrate 28% of HHs and HSY Choc Syrup 20% of HHs Demographics Role Assessment Strategy Recommendations Nielsen Answers Ad Hoc Base
Analysis shows this is a “CASH MANCHINE” Demographics Role Assessment Strategy Recommendations SYRUP TOPPINGS Avg Margin per SKU of all retailers: 36.2% Total Chocolate Syrup Market: $181.3 M Nielsen Answers Ad Hoc Base
55 total SKUs found: Syrups, Shells, Specialty Demographics Role Assessment Strategy Recommendations 55 total SKUs found: -Syrups -Shells -Specialty
Harps Wed. and WM 6th had deepest assortments with 62% of SKUs available Demographics Role Assessment Strategy Recommendations
Smuckersand Hershey own 74.5% of SKUs Demographics Role Assessment Strategy Recommendations
Smuckers has highest per ounce cost but HSY has highest unit cost, PL is cost leader Demographics Role Assessment Strategy Recommendations
Harps and Walgreens have the highest GM% Demographics Role Assessment Strategy Recommendations
Retailers dedicate majority of space to Smuckers and Hershey despite lower margins Demographics Role Assessment Strategy Recommendations
Facing proliferation is driven not by GM% but rather velocity Demographics Role Assessment Strategy Recommendations
Facing proliferation is driven not by GM% but rather velocity Demographics Role Assessment Strategy Recommendations
Suppliers control this category Demographics Role Assessment Strategy Recommendations • Each retailer approaches category differently • Reoccurring theme: Small Private Label presence • Walgreens does not compete heavily in this category (2 SKUs) • Average margins high at 42.5% • Other Retailers use category as “Cash Machine” with moderate to heavy depth and generous margins
Focus on category optimization Demographics Role Assessment Strategy Recommendations • No flavor innovation will overcome major category players • Retailers need to focus on depth optimization. • Secondary players in category can increase GM% • Walgreens has opportunity to expand depth and be more competitive in the market • Size/Price innovation: introduction of smaller offerings • Lower price points instead of lower price/oz. • Category locations • WM needs to locate near ice cream
Walmart #144 (MLK) Demographics Role Assessment Strategy Recommendations
Walmart #144 (MLK) Demographics Role Assessment Strategy Recommendations Low Income HHs Age 18 – 34 HHs 1 person HHs Renting HHs “Struggling HHs”
Walmart #144 (MLK) Demographics Role Assessment Strategy Recommendations