Download
1 / 18
180 likes | 256 Views
Paint IT Green conference When should I do my bit?. www.herts.ac.uk/computerscience. Wednesday, 8 th September 2010 University of Hertford. Paint IT Green conference When should I do my bit?. Howard Noble Oxford University Computing Services http://projects.oucs.ox.ac.uk/lowcarbonict/.

E N D
Paint IT Green conference When should I do my bit? www.herts.ac.uk/computerscience
Wednesday, 8th September 2010 University of Hertford Paint IT Green conference When should I do my bit? Howard Noble Oxford University Computing Services http://projects.oucs.ox.ac.uk/lowcarbonict/
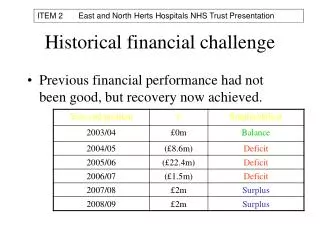
Strategy A - Leave computers on all year: 110/1000 x (24 x 365) x 16,000 x £0.12 = £1,850,112 Strategy B - Power them down after work: 110/1000 x (10 x 223) x 16,000 x £0.12 = £470,976
Why are idle computers left on? • To allow IT managers to install software updates and make backups • So computers can be accessed remotely by end-users • Sleep mode (ACPI S3) is unreliable • People forget to power them down • People don’t like to wait for their computer to start up
Centrally provided IT services Central Backup service Send ‘magic packet’ Send ARP query Single sign-on Request wake on LAN Register and wake computers WOL web pages Central WOL server Request wake on LAN Request wake on LAN FiDo software installation ARP query data Single sign-on Central PMM server View graph - adjust behaviour accordingly PMM web pages College and department networks Google Visualisation API
Why do this? • CRC Energy Efficiency Scheme: http://www.decc.gov.uk/en/content/cms/what_we_do/lc_uk/crc.aspx • HEFCE Carbon Management Strategy: http://www.hefce.ac.uk/pubs/hefce/2010/10_02/ • Help groups reduce costs and enhance their environmental performance • Help people make a rational response to the risks associated with climate change
A thought experiment: Consider a population where: 20% have reduced their consumption significantly 30% consume to their heart’s desire 50% mirror the consumption patterns of people close to them What effect might the 20% have on overall consumption? • It will decrease • It will stay the same • It will increase
Turn your office computer off every day after work • Use 50% less water • Use 50% less gas • Use 50% less electricity • 50% fewer car miles • 80% fewer air miles over 5 year period • Extend life-cycle of an IT device by 3 years • Give £5 to a charity • Give £1000 to a charity • Persuade a friend to do any of the above • Persuade a group (school, workplace) to do any of the above Inconvenience to you Visibility of your action Benefit to planet
What do individuals think when they see statistics that are meant to motivate them to change their behaviour?
The MO project Open data Social capital Access, store and share energy data Representation of social capital Culture of action on environmental issues Enable people to form groups and make comparisons between groups Visualise data so people can understand how they relate to it Facilitate the emergence of trust and altruistic punishment Link energy data with other relevant data sets