Download
1 / 92
920 likes | 1.02k Views
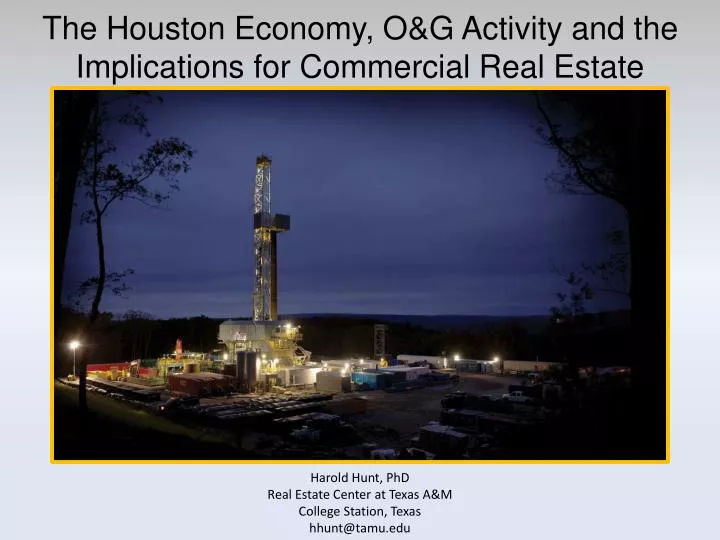
The Houston Economy, O&G Activity and the Implications for Commercial Real Estate Harold Hunt, PhD Real Estate Center at Texas A&M College Station, Texas hhunt@tamu.edu. A Brief Economic Overview. Texas Job Growth. Texas versus the U.S. 3.4%. 1.8%. Texas Job Growth.

E N D
The Houston Economy, O&G Activity and the Implications for Commercial Real EstateHarold Hunt, PhDReal Estate Center at Texas A&MCollege Station, Texashhunt@tamu.edu
Texas Job Growth • Texasversus the U.S. 3.4% 1.8%
Texas Job Growth • Texas still capturing market sharein private-sector jobs. 347,200 / 2,470,000 =14.1%of private job growth 25 mil. / 300 mil. = 8% of pop.
Texas Employment Growth by Industry • Mining (O&G) again the leader (by %).
Texas Employment Growth by Industry • Prof. & Bus. Services the absolute leader.
Job Growth Past 12 MonthsEnding August, 2014 Source: Texas Workforce Commission
Job Growth Past 12 MonthsEnding August, 2014 Source: Texas Workforce Commission
Job Growth Past 12 MonthsEnding August, 2014 Source: Texas Workforce Commission
Houston MSA Employment and Annual Employment Growth by Category( August, 2014) Biggest absolute increase in jobs Biggest % increase in jobs Source: Texas Workforce Commission
How Large is the Energy Industry in Houston? Recent estimates by the Bureau of Economic Analysis (BEA) say: • The Mining & Logging (O&G) sector in Houston accounted for 19.8% of the region’s GDP. • When you add in chemicals, refining, and oilfield equipment manufacturing, energy accounts for 32.0% of the region’s GDP. • When you add in fabricated metal products, P/L transportation, and engineering services, energy accounts for 38.1% of the region’s GDP. Source: GHP: The Economy at a Glance Oct. 2014
So Where is the Energy Sector Headed? The most critical question for real estate professionals still seems to be: • How long will the drilling activity in Texas last?
Active Drilling Rigs in Texas(As of October 17th, 2014) Source: Baker Hughes
Rig Counts(Land Rigs: October 17th, 2014 vs October 18th, 2013)
Two Definitions • Porosity - the percentage of void space in a material. • Permeability – The property of a porous material to permit a liquid or gas to pass through it.
Permeability of Shale Mid-East Reservoirs Shales Source: SPE International
Conventional vs Unconventional Drilling Low Permeability Source rock 5,000 ft. or more Source: U.S. Energy Information Administration
My Early Prediction of the Length of Eagle Ford Drilling Activity The Dallas Federal Reserve reported that 5 mil. acres of the Eagle Ford are under lease. So I assumed: • 4 mil. acres/200 acres drained per well = 20k total wells • 250 rigs x 5 wells drilled per yr. = 1,250 wells per yr. • 20k wells needed/1,250 wells per yr. = 16 years to drill
Completed Wells in the Eagle Ford As of Aug, 2011: 263 Producing Oil Wells 394 Producing Gas Wells Source: Texas Railroad Commission
Completed Wells in the Eagle Ford 11 Months Later… As of July, 2012: 1,690 Producing Oil Wells 710 Producing Gas Wells An Increase of: 1,427 Producing Oil Wells 316 Producing Gas Wells Total Increase: 1,743 wells Source: Texas Railroad Commission
Completed Wells in the Eagle Ford 12 Months Later… As of July, 2013: 3,868 Producing Oil Wells 1,681 Producing Gas Wells An Increase of: 2,178 Producing Oil Wells 971 Producing Gas Wells Total Increase: 3,149 wells Source: Texas Railroad Commission
Completed Wells in the Eagle Ford 12 Months Later… As of July, 2014: 6,414 Producing Oil Wells 3,214 Producing Gas Wells An Increase of: 2,546 Producing Oil Wells 1,533 Producing Gas Wells Total Increase: 4,079 wells Source: Texas Railroad Commission
Several Factors Affect the Speed and Number of Wells that Get Drilled • Drilling one well to “hold a field by production” giving way to “pad drilling” where multiple wells are drilled from one drillsite, saving time and money. • Drilling rigs that “walk” or move along rails will significantly reduce the downtime between drilling a well. • Thewell spacing continues to tighten, leading to more producing wells on a given amount of acreage. • Tapping other pay zones will extend the drilling activity in fields.
4 Wells Just Drilled by EOG in Gonzales Co. (using FracFocus.org)
Increasing Efficiency Begins to Show Up 2012 Q1 Started 1 well every 24 days 2014 Q3 Started 1 well every 16 days Source: Baker Hughes Quarterly Well Count Report
Well Costs Dropped from $14 mil. to $6 mil. Sept. 2010 Sept. 2013 Source: UTSA Economic Impact of the Eagle Ford Shale Study
Rosetta Resources Map of Its Well Spacing Plan Source: Rosetta Resources
EOG Pushed Downspacing, Dramatically Increasing the Well Count
Factors to Consider With Increased Downspacing • When laterals get close enough, they start to rob production from each other. • A Marathon test showed two wells on 40-acre spacing each had about 80% of the recovery as one well on 80-acre spacing. Ex. 1 well @ 80 acres produces 1,000 bbls of oil (Total = 1,000 bbls) vs 2 wells @ 40 acres produce 800 bbls of oil each (Total = 1,600 bbls) • So increased production from downspacing must be weighed against increased well cost.
Multiple Payzones Could Extend the Drilling Activity in a Play Austin Chalk Eagle Ford Buda Pearsall
Multiple Payzones Could Extend the Drilling Activity in a Play The Permian 13 Payzones identified so far by Pioneer Pearsall
Horizontal Wells Using Pad Drilling in Multiple Stacked Plays